Zip Codes with the Highest Percentage of Population Employed in Administrative & Support Services in West Des Moines, IA
RELATED REPORTS & OPTIONS
Administrative & Support Services
West Des Moines
Compare Zip Codes
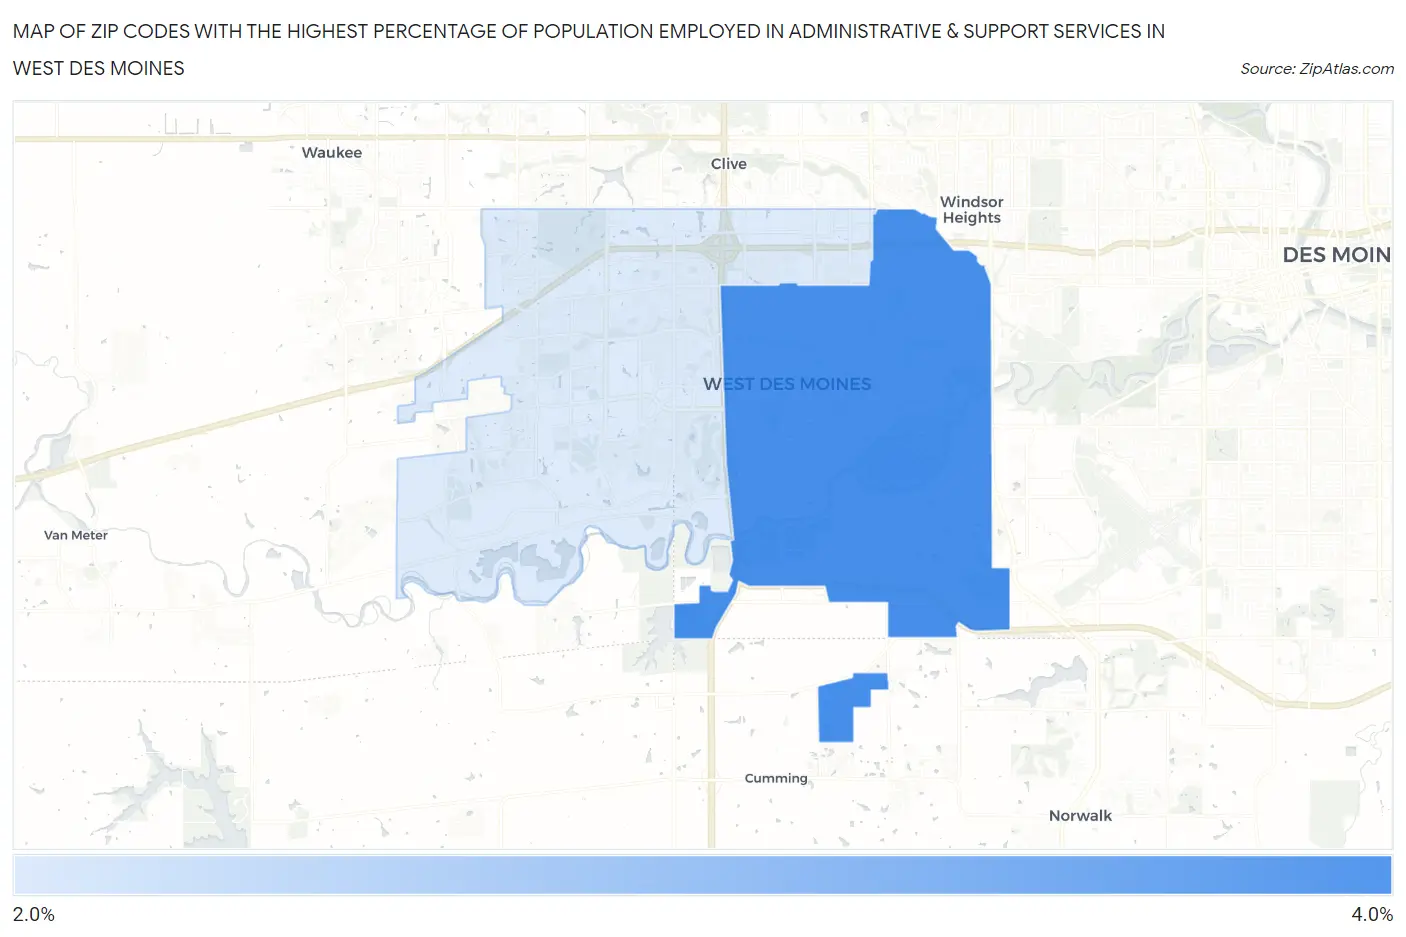
Map of Zip Codes with the Highest Percentage of Population Employed in Administrative & Support Services in West Des Moines
2.9%
3.3%
Zip Codes with the Highest Percentage of Population Employed in Administrative & Support Services in West Des Moines, IA
| Zip Code | % Employed | vs State | vs National | |
| 1. | 50265 | 3.3% | 3.0%(+0.301)#265 | 4.1%(-0.820)#13,790 |
| 2. | 50266 | 2.9% | 3.0%(-0.144)#317 | 4.1%(-1.27)#16,072 |
1
Common Questions
What are the Top Zip Codes with the Highest Percentage of Population Employed in Administrative & Support Services in West Des Moines, IA?
Top Zip Codes with the Highest Percentage of Population Employed in Administrative & Support Services in West Des Moines, IA are:
What zip code has the Highest Percentage of Population Employed in Administrative & Support Services in West Des Moines, IA?
50265 has the Highest Percentage of Population Employed in Administrative & Support Services in West Des Moines, IA with 3.3%.
What is the Percentage of Population Employed in Administrative & Support Services in West Des Moines, IA?
Percentage of Population Employed in Administrative & Support Services in West Des Moines is 3.1%.
What is the Percentage of Population Employed in Administrative & Support Services in Iowa?
Percentage of Population Employed in Administrative & Support Services in Iowa is 3.0%.
What is the Percentage of Population Employed in Administrative & Support Services in the United States?
Percentage of Population Employed in Administrative & Support Services in the United States is 4.1%.