Zip Codes with the Highest Percentage of Households Heated by Utility Gas in West Des Moines, IA
RELATED REPORTS & OPTIONS
Utility Gas Heating
West Des Moines
Compare Zip Codes
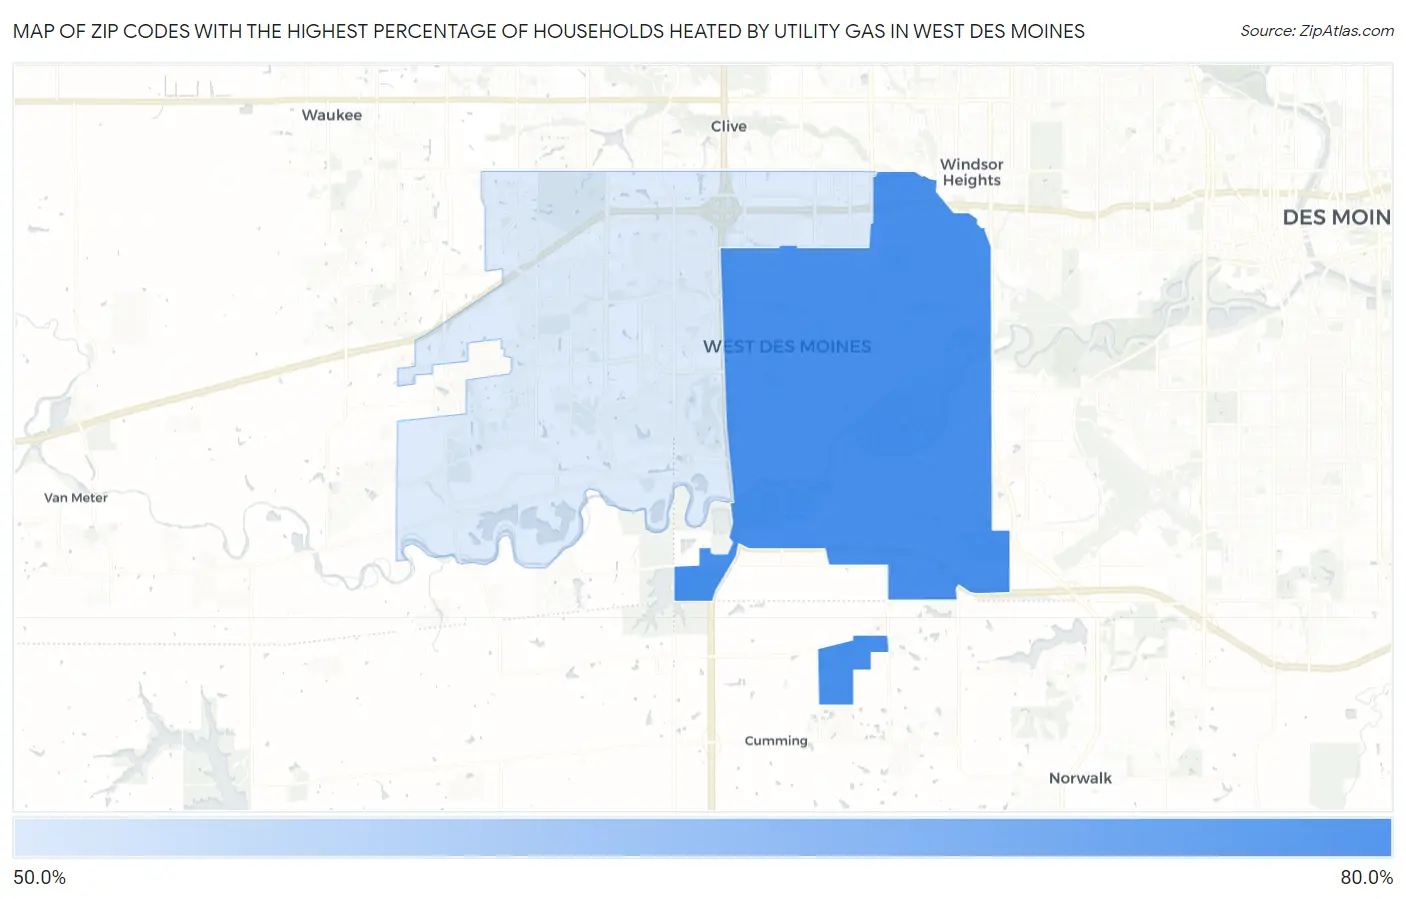
Map of Zip Codes with the Highest Percentage of Households Heated by Utility Gas in West Des Moines
52.6%
64.7%
Zip Codes with the Highest Percentage of Households Heated by Utility Gas in West Des Moines, IA
| Zip Code | Utility Gas Heating | vs State | vs National | |
| 1. | 50265 | 64.7% | 60.6%(+4.10)#159 | 47.1%(+17.6)#6,065 |
| 2. | 50266 | 52.6% | 60.6%(-8.00)#346 | 47.1%(+5.50)#9,473 |
1
Common Questions
What are the Top Zip Codes with the Highest Percentage of Households Heated by Utility Gas in West Des Moines, IA?
Top Zip Codes with the Highest Percentage of Households Heated by Utility Gas in West Des Moines, IA are:
What zip code has the Highest Percentage of Households Heated by Utility Gas in West Des Moines, IA?
50265 has the Highest Percentage of Households Heated by Utility Gas in West Des Moines, IA with 64.7%.
What is the Percentage of Households Heated by Utility Gas in West Des Moines, IA?
Percentage of Households Heated by Utility Gas in West Des Moines is 58.3%.
What is the Percentage of Households Heated by Utility Gas in Iowa?
Percentage of Households Heated by Utility Gas in Iowa is 60.6%.
What is the Percentage of Households Heated by Utility Gas in the United States?
Percentage of Households Heated by Utility Gas in the United States is 47.1%.