Zip Codes with the Highest Percentage of Population Employed in Architecture & Engineering in Atlanta, GA
RELATED REPORTS & OPTIONS
Architecture & Engineering
Atlanta
Compare Zip Codes
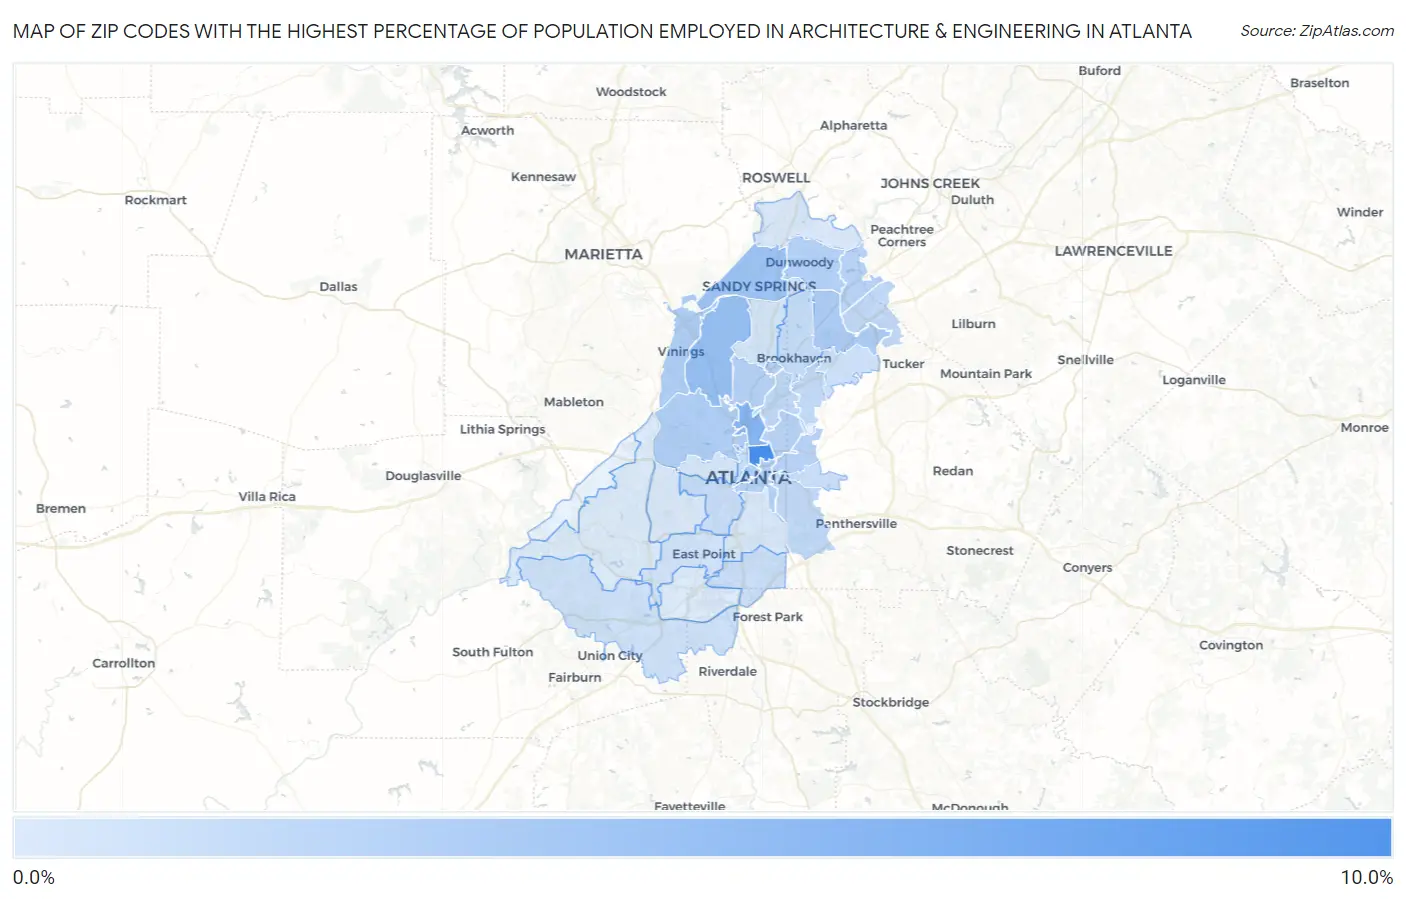
Map of Zip Codes with the Highest Percentage of Population Employed in Architecture & Engineering in Atlanta
0.59%
9.2%
Zip Codes with the Highest Percentage of Population Employed in Architecture & Engineering in Atlanta, GA
| Zip Code | % Employed | vs State | vs National | |
| 1. | 30308 | 9.2% | 1.8%(+7.45)#3 | 2.1%(+7.10)#392 |
| 2. | 30363 | 5.4% | 1.8%(+3.59)#15 | 2.1%(+3.23)#1,400 |
| 3. | 30309 | 5.4% | 1.8%(+3.58)#16 | 2.1%(+3.23)#1,405 |
| 4. | 30327 | 4.5% | 1.8%(+2.73)#24 | 2.1%(+2.37)#2,097 |
| 5. | 30328 | 4.1% | 1.8%(+2.27)#32 | 2.1%(+1.91)#2,681 |
| 6. | 30341 | 3.4% | 1.8%(+1.58)#50 | 2.1%(+1.22)#4,014 |
| 7. | 30339 | 3.2% | 1.8%(+1.37)#68 | 2.1%(+1.02)#4,547 |
| 8. | 30318 | 3.2% | 1.8%(+1.36)#69 | 2.1%(+1.00)#4,598 |
| 9. | 30303 | 3.0% | 1.8%(+1.22)#82 | 2.1%(+0.861)#5,024 |
| 10. | 30338 | 2.9% | 1.8%(+1.10)#92 | 2.1%(+0.748)#5,427 |
| 11. | 30305 | 2.8% | 1.8%(+0.966)#101 | 2.1%(+0.612)#5,922 |
| 12. | 30326 | 2.8% | 1.8%(+0.966)#102 | 2.1%(+0.612)#5,923 |
| 13. | 30312 | 2.7% | 1.8%(+0.950)#105 | 2.1%(+0.595)#5,988 |
| 14. | 30307 | 2.6% | 1.8%(+0.830)#114 | 2.1%(+0.475)#6,473 |
| 15. | 30360 | 2.6% | 1.8%(+0.817)#117 | 2.1%(+0.462)#6,526 |
| 16. | 30306 | 2.6% | 1.8%(+0.810)#118 | 2.1%(+0.456)#6,557 |
| 17. | 30324 | 2.3% | 1.8%(+0.480)#149 | 2.1%(+0.125)#8,074 |
| 18. | 30316 | 2.1% | 1.8%(+0.305)#172 | 2.1%(-0.049)#9,044 |
| 19. | 30340 | 2.1% | 1.8%(+0.297)#175 | 2.1%(-0.057)#9,094 |
| 20. | 30329 | 2.1% | 1.8%(+0.295)#176 | 2.1%(-0.059)#9,109 |
| 21. | 30319 | 1.9% | 1.8%(+0.096)#207 | 2.1%(-0.258)#10,305 |
| 22. | 30313 | 1.9% | 1.8%(+0.072)#210 | 2.1%(-0.283)#10,449 |
| 23. | 30310 | 1.7% | 1.8%(-0.058)#225 | 2.1%(-0.412)#11,254 |
| 24. | 30317 | 1.7% | 1.8%(-0.105)#232 | 2.1%(-0.460)#11,575 |
| 25. | 30354 | 1.6% | 1.8%(-0.161)#246 | 2.1%(-0.516)#11,955 |
| 26. | 30332 | 1.6% | 1.8%(-0.166)#247 | 2.1%(-0.520)#11,982 |
| 27. | 30345 | 1.5% | 1.8%(-0.281)#259 | 2.1%(-0.635)#12,781 |
| 28. | 30349 | 1.4% | 1.8%(-0.371)#265 | 2.1%(-0.725)#13,402 |
| 29. | 30346 | 1.3% | 1.8%(-0.455)#272 | 2.1%(-0.810)#14,031 |
| 30. | 30344 | 1.2% | 1.8%(-0.548)#289 | 2.1%(-0.903)#14,706 |
| 31. | 30342 | 1.1% | 1.8%(-0.708)#327 | 2.1%(-1.06)#15,966 |
| 32. | 30314 | 0.97% | 1.8%(-0.826)#345 | 2.1%(-1.18)#16,850 |
| 33. | 30315 | 0.88% | 1.8%(-0.918)#358 | 2.1%(-1.27)#17,558 |
| 34. | 30311 | 0.75% | 1.8%(-1.04)#397 | 2.1%(-1.40)#18,537 |
| 35. | 30350 | 0.72% | 1.8%(-1.07)#402 | 2.1%(-1.43)#18,745 |
| 36. | 30331 | 0.61% | 1.8%(-1.19)#423 | 2.1%(-1.54)#19,577 |
| 37. | 30337 | 0.59% | 1.8%(-1.20)#426 | 2.1%(-1.56)#19,690 |
1
Common Questions
What are the Top 10 Zip Codes with the Highest Percentage of Population Employed in Architecture & Engineering in Atlanta, GA?
Top 10 Zip Codes with the Highest Percentage of Population Employed in Architecture & Engineering in Atlanta, GA are:
What zip code has the Highest Percentage of Population Employed in Architecture & Engineering in Atlanta, GA?
30308 has the Highest Percentage of Population Employed in Architecture & Engineering in Atlanta, GA with 9.2%.
What is the Percentage of Population Employed in Architecture & Engineering in Atlanta, GA?
Percentage of Population Employed in Architecture & Engineering in Atlanta is 2.8%.
What is the Percentage of Population Employed in Architecture & Engineering in Georgia?
Percentage of Population Employed in Architecture & Engineering in Georgia is 1.8%.
What is the Percentage of Population Employed in Architecture & Engineering in the United States?
Percentage of Population Employed in Architecture & Engineering in the United States is 2.1%.