Zip Codes with the Highest Percentage of Population Employed in Accommodation & Food Services in Atlanta, GA
RELATED REPORTS & OPTIONS
Accommodation & Food Services
Atlanta
Compare Zip Codes
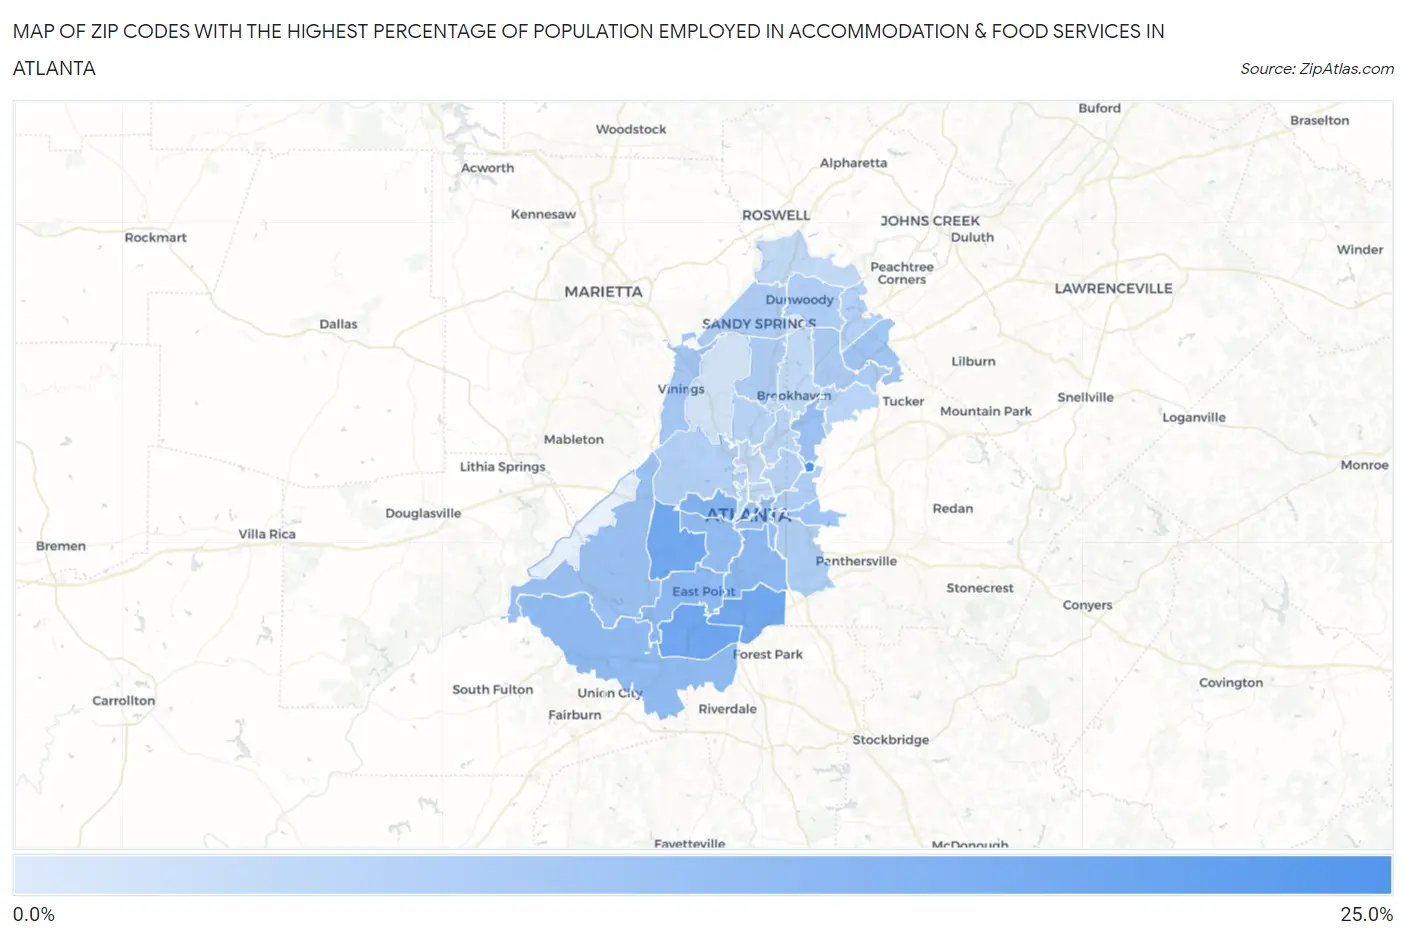
Map of Zip Codes with the Highest Percentage of Population Employed in Accommodation & Food Services in Atlanta
0.55%
20.1%
Zip Codes with the Highest Percentage of Population Employed in Accommodation & Food Services in Atlanta, GA
| Zip Code | % Employed | vs State | vs National | |
| 1. | 30322 | 20.1% | 7.2%(+12.9)#11 | 6.9%(+13.2)#821 |
| 2. | 30337 | 14.2% | 7.2%(+7.04)#31 | 6.9%(+7.37)#1,895 |
| 3. | 30354 | 14.0% | 7.2%(+6.83)#33 | 6.9%(+7.16)#1,958 |
| 4. | 30311 | 14.0% | 7.2%(+6.81)#34 | 6.9%(+7.14)#1,965 |
| 5. | 30314 | 11.9% | 7.2%(+4.69)#59 | 6.9%(+5.02)#2,909 |
| 6. | 30315 | 10.4% | 7.2%(+3.23)#80 | 6.9%(+3.56)#4,063 |
| 7. | 30344 | 10.4% | 7.2%(+3.18)#84 | 6.9%(+3.50)#4,115 |
| 8. | 30349 | 10.0% | 7.2%(+2.78)#97 | 6.9%(+3.10)#4,566 |
| 9. | 30310 | 9.6% | 7.2%(+2.41)#117 | 6.9%(+2.74)#5,034 |
| 10. | 30303 | 9.1% | 7.2%(+1.88)#140 | 6.9%(+2.21)#5,807 |
| 11. | 30312 | 8.8% | 7.2%(+1.62)#148 | 6.9%(+1.95)#6,228 |
| 12. | 30329 | 8.6% | 7.2%(+1.40)#163 | 6.9%(+1.73)#6,625 |
| 13. | 30331 | 8.5% | 7.2%(+1.32)#166 | 6.9%(+1.65)#6,772 |
| 14. | 30317 | 7.9% | 7.2%(+0.742)#203 | 6.9%(+1.07)#7,928 |
| 15. | 30340 | 7.5% | 7.2%(+0.333)#234 | 6.9%(+0.658)#8,893 |
| 16. | 30339 | 7.3% | 7.2%(+0.058)#253 | 6.9%(+0.383)#9,638 |
| 17. | 30341 | 6.4% | 7.2%(-0.780)#331 | 6.9%(-0.455)#12,077 |
| 18. | 30307 | 6.3% | 7.2%(-0.893)#342 | 6.9%(-0.568)#12,437 |
| 19. | 30328 | 6.2% | 7.2%(-0.968)#348 | 6.9%(-0.643)#12,685 |
| 20. | 30316 | 6.0% | 7.2%(-1.20)#361 | 6.9%(-0.878)#13,435 |
| 21. | 30338 | 6.0% | 7.2%(-1.21)#362 | 6.9%(-0.889)#13,467 |
| 22. | 30342 | 5.9% | 7.2%(-1.34)#375 | 6.9%(-1.02)#13,902 |
| 23. | 30318 | 5.5% | 7.2%(-1.68)#394 | 6.9%(-1.35)#14,949 |
| 24. | 30360 | 5.5% | 7.2%(-1.69)#397 | 6.9%(-1.37)#15,010 |
| 25. | 30313 | 5.1% | 7.2%(-2.09)#425 | 6.9%(-1.76)#16,393 |
| 26. | 30306 | 5.0% | 7.2%(-2.17)#433 | 6.9%(-1.85)#16,716 |
| 27. | 30305 | 4.7% | 7.2%(-2.47)#459 | 6.9%(-2.15)#17,708 |
| 28. | 30345 | 4.7% | 7.2%(-2.50)#463 | 6.9%(-2.18)#17,812 |
| 29. | 30324 | 4.6% | 7.2%(-2.60)#473 | 6.9%(-2.28)#18,151 |
| 30. | 30308 | 3.9% | 7.2%(-3.28)#520 | 6.9%(-2.96)#20,404 |
| 31. | 30332 | 3.9% | 7.2%(-3.34)#524 | 6.9%(-3.01)#20,584 |
| 32. | 30309 | 3.8% | 7.2%(-3.39)#526 | 6.9%(-3.06)#20,736 |
| 33. | 30350 | 3.7% | 7.2%(-3.55)#535 | 6.9%(-3.23)#21,273 |
| 34. | 30319 | 3.5% | 7.2%(-3.70)#546 | 6.9%(-3.38)#21,757 |
| 35. | 30326 | 3.0% | 7.2%(-4.26)#578 | 6.9%(-3.93)#23,337 |
| 36. | 30363 | 2.6% | 7.2%(-4.62)#592 | 6.9%(-4.30)#24,283 |
| 37. | 30327 | 1.6% | 7.2%(-5.59)#624 | 6.9%(-5.26)#26,266 |
| 38. | 30346 | 0.55% | 7.2%(-6.65)#654 | 6.9%(-6.33)#27,825 |
1
Common Questions
What are the Top 10 Zip Codes with the Highest Percentage of Population Employed in Accommodation & Food Services in Atlanta, GA?
Top 10 Zip Codes with the Highest Percentage of Population Employed in Accommodation & Food Services in Atlanta, GA are:
What zip code has the Highest Percentage of Population Employed in Accommodation & Food Services in Atlanta, GA?
30322 has the Highest Percentage of Population Employed in Accommodation & Food Services in Atlanta, GA with 20.1%.
What is the Percentage of Population Employed in Accommodation & Food Services in Atlanta, GA?
Percentage of Population Employed in Accommodation & Food Services in Atlanta is 6.8%.
What is the Percentage of Population Employed in Accommodation & Food Services in Georgia?
Percentage of Population Employed in Accommodation & Food Services in Georgia is 7.2%.
What is the Percentage of Population Employed in Accommodation & Food Services in the United States?
Percentage of Population Employed in Accommodation & Food Services in the United States is 6.9%.