Zip Codes with the Highest Percentage of Population with a Degree in Computers and Mathematics in Atlanta, GA

RELATED REPORTS & OPTIONS

Computers and Mathematics
Population
Families and Households
Female Fertility
Female Fertility (Unmarried)
Race (Community Size)
Race (Percentage)
Ancestry (Community Size)
AfghanAfricanAlbanianAmericanApacheArabArgentineanArmenianAssyrian / Chaldean / SyriacAustralianAustrianBahamianBangladeshiBarbadianBelgianBelizeanBermudanBhutaneseBlackfeetBolivianBrazilianBritishBritish West IndianBulgarianBurmeseCajunCambodianCanadianCape VerdeanCelticCentral AmericanCentral American IndianCherokeeChickasawChileanChippewaChoctawColombianCosta RicanCreekCroatianCubanCzechCzechoslovakianDanishDominicanDutchDutch West IndianEastern EuropeanEcuadorianEgyptianEnglishEstonianEthiopianEuropeanFilipinoFinnishFrenchFrench CanadianGermanGhanaianGreekGuamanian / ChamorroGuatemalanGuyaneseHaitianHonduranHungarianIcelanderIndian (Asian)IndonesianIranianIraqiIrishIroquoisIsraeliItalianJamaicanJapaneseJordanianKenyanKoreanLaotianLatvianLebaneseLiberianLithuanianLumbeeLuxembourgerMacedonianMalaysianMalteseMexicanMexican American IndianMongolianMoroccanNative HawaiianNavajoNew ZealanderNicaraguanNigerianNorthern EuropeanNorwegianOsagePakistaniPalestinianPanamanianParaguayanPennsylvania GermanPeruvianPolishPortuguesePotawatomiPuerto RicanRomanianRussianSalvadoranSamoanScandinavianScotch-IrishScottishSeminoleSenegaleseSerbianSierra LeoneanSiouxSlavicSlovakSloveneSomaliSouth AfricanSouth AmericanSouth American IndianSoviet UnionSpaniardSpanishSpanish AmericanSri LankanSubsaharan AfricanSudaneseSwedishSwissSyrianThaiTrinidadian and TobagonianTurkishU.S. Virgin IslanderUgandanUkrainianUruguayanVenezuelanVietnameseWelshWest IndianYugoslavianZimbabwean
Ancestry (Percentage)
AfghanAfricanAlbanianAmericanApacheArabArgentineanArmenianAssyrian / Chaldean / SyriacAustralianAustrianBahamianBangladeshiBarbadianBelgianBelizeanBermudanBhutaneseBlackfeetBolivianBrazilianBritishBritish West IndianBulgarianBurmeseCajunCambodianCanadianCape VerdeanCelticCentral AmericanCentral American IndianCherokeeChickasawChileanChippewaChoctawColombianCosta RicanCreekCroatianCubanCzechCzechoslovakianDanishDominicanDutchDutch West IndianEastern EuropeanEcuadorianEgyptianEnglishEstonianEthiopianEuropeanFilipinoFinnishFrenchFrench CanadianGermanGhanaianGreekGuamanian / ChamorroGuatemalanGuyaneseHaitianHonduranHungarianIcelanderIndian (Asian)IndonesianIranianIraqiIrishIroquoisIsraeliItalianJamaicanJapaneseJordanianKenyanKoreanLaotianLatvianLebaneseLiberianLithuanianLumbeeLuxembourgerMacedonianMalaysianMalteseMexicanMexican American IndianMongolianMoroccanNative HawaiianNavajoNew ZealanderNicaraguanNigerianNorthern EuropeanNorwegianOsagePakistaniPalestinianPanamanianParaguayanPennsylvania GermanPeruvianPolishPortuguesePotawatomiPuerto RicanRomanianRussianSalvadoranSamoanScandinavianScotch-IrishScottishSeminoleSenegaleseSerbianSierra LeoneanSiouxSlavicSlovakSloveneSomaliSouth AfricanSouth AmericanSouth American IndianSoviet UnionSpaniardSpanishSpanish AmericanSri LankanSubsaharan AfricanSudaneseSwedishSwissSyrianThaiTrinidadian and TobagonianTurkishU.S. Virgin IslanderUgandanUkrainianUruguayanVenezuelanVietnameseWelshWest IndianYugoslavianZimbabwean
Immigrant Origin (Total)
AfghanistanAfricaArgentinaArmeniaAsiaAustraliaAustriaBahamasBangladeshBarbadosBelarusBelgiumBelizeBoliviaBosnia and HerzegovinaBrazilBulgariaCambodiaCameroonCanadaCaribbeanCentral AmericaChileChinaColombiaCongoCosta RicaCroatiaCubaCzechoslovakiaDenmarkDominicaDominican RepublicEastern AfricaEastern AsiaEastern EuropeEcuadorEgyptEl SalvadorEnglandEritreaEthiopiaEuropeFranceGermanyGhanaGreeceGrenadaGuatemalaGuyanaHaitiHondurasHong KongHungaryIndiaIndonesiaIranIraqIrelandIsraelItalyJamaicaJapanJordanKenyaKoreaKuwaitLaosLatin AmericaLatviaLebanonLiberiaLithuaniaMalaysiaMexicoMiddle AfricaMoldovaMoroccoNepalNetherlandsNicaraguaNigeriaNorthern AfricaNorthern EuropeOceaniaPakistanPanamaPeruPhilippinesPolandPortugalRomaniaRussiaSaudi ArabiaScotlandSenegalSerbiaSierra LeoneSingaporeSouth AfricaSouth AmericaSouth Central AsiaSouth Eastern AsiaSouthern EuropeSpainSri LankaSt. Vincent and the GrenadinesSudanSwedenSwitzerlandSyriaTaiwanThailandTrinidad and TobagoTurkeyUgandaUkraineUruguayUzbekistanVenezuelaVietnamWest IndiesWestern AfricaWestern AsiaWestern EuropeZaireZimbabwe
Immigrant Origin (Percentage)
AfghanistanAfricaArgentinaArmeniaAsiaAustraliaAustriaBahamasBangladeshBarbadosBelarusBelgiumBelizeBoliviaBosnia and HerzegovinaBrazilBulgariaCambodiaCameroonCanadaCaribbeanCentral AmericaChileChinaColombiaCongoCosta RicaCroatiaCubaCzechoslovakiaDenmarkDominicaDominican RepublicEastern AfricaEastern AsiaEastern EuropeEcuadorEgyptEl SalvadorEnglandEritreaEthiopiaEuropeFranceGermanyGhanaGreeceGrenadaGuatemalaGuyanaHaitiHondurasHong KongHungaryIndiaIndonesiaIranIraqIrelandIsraelItalyJamaicaJapanJordanKenyaKoreaKuwaitLaosLatin AmericaLatviaLebanonLiberiaLithuaniaMalaysiaMexicoMiddle AfricaMoldovaMoroccoNepalNetherlandsNicaraguaNigeriaNorthern AfricaNorthern EuropeOceaniaPakistanPanamaPeruPhilippinesPolandPortugalRomaniaRussiaSaudi ArabiaScotlandSenegalSerbiaSierra LeoneSingaporeSouth AfricaSouth AmericaSouth Central AsiaSouth Eastern AsiaSouthern EuropeSpainSri LankaSt. Vincent and the GrenadinesSudanSwedenSwitzerlandSyriaTaiwanThailandTrinidad and TobagoTurkeyUgandaUkraineUruguayUzbekistanVenezuelaVietnamWest IndiesWestern AfricaWestern AsiaWestern EuropeZaireZimbabwe
Income
Income (Families)
Income (Households)
Poverty
Poverty (Families)
Unemployment
Employment Occupations
Employment Industries
Employer Class
Commute Time
Commute Means
School Enrollment
Education by Degree Field
Occupancy
Finances
Physical Characteristics
Atlanta
Compare Zip Codes
Comparison Subject

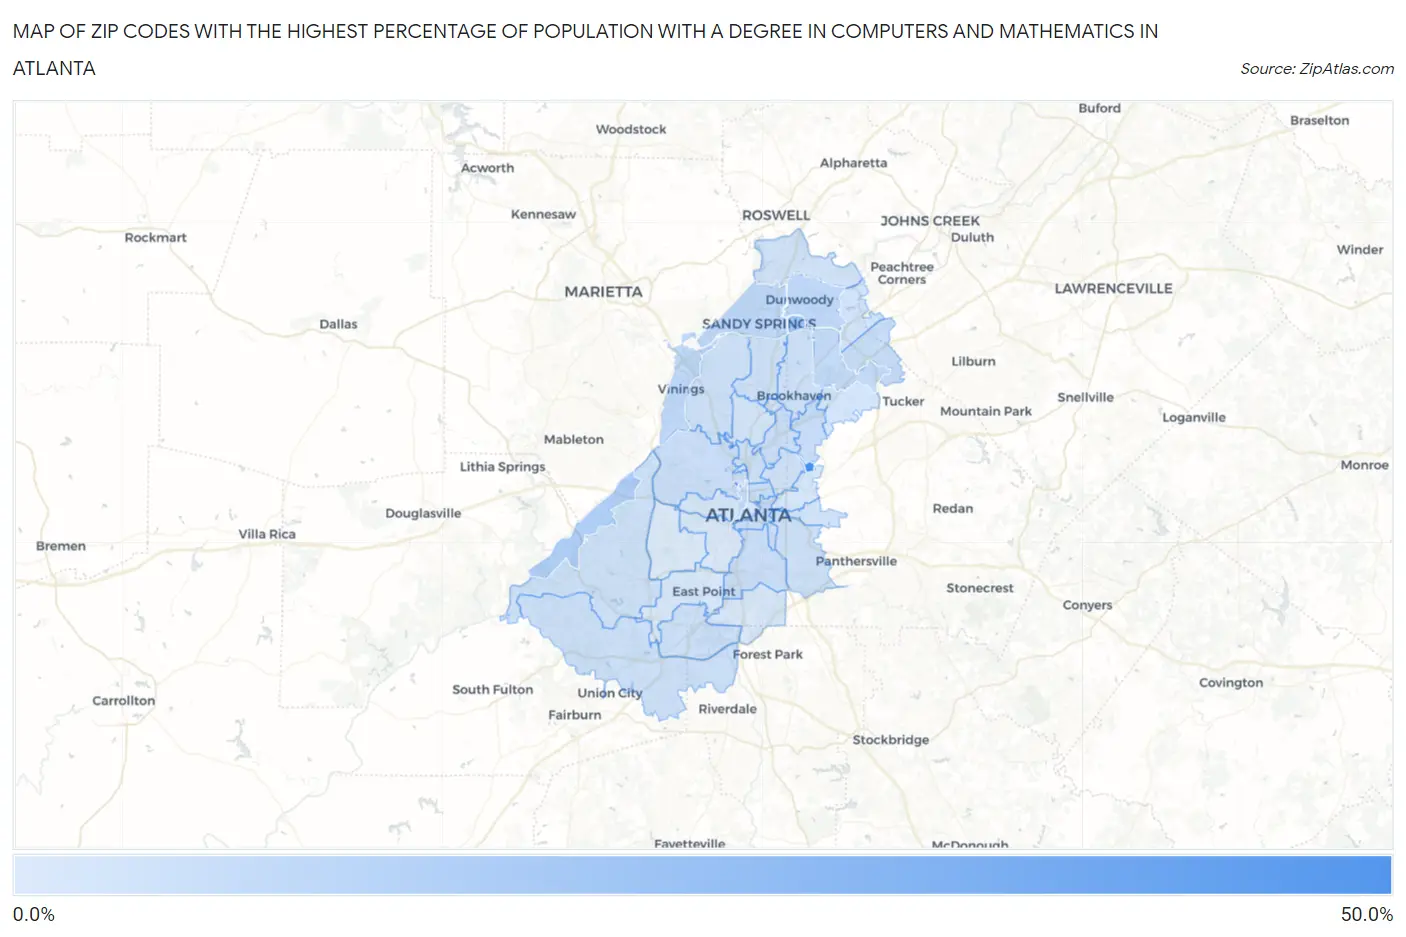
Map of Zip Codes with the Highest Percentage of Population with a Degree in Computers and Mathematics in Atlanta

0.0%
50.0%
Zip Codes with the Highest Percentage of Population with a Degree in Computers and Mathematics in Atlanta Map

Zip Codes with the Highest Percentage of Population with a Degree in Computers and Mathematics in Atlanta, GA

Zip Code % Graduates vs State vs National
1.3032247.6%5.5%(+42.1)#14.9%(+42.7)#94
2.3033246.2%5.5%(+40.6)#24.9%(+41.3)#101
3.3034618.4%5.5%(+12.9)#94.9%(+13.5)#545
4.3033614.1%5.5%(+8.59)#164.9%(+9.21)#898
5.303289.6%5.5%(+4.11)#504.9%(+4.73)#1,913
6.303139.2%5.5%(+3.66)#554.9%(+4.28)#2,131
7.303399.1%5.5%(+3.57)#574.9%(+4.20)#2,176
8.303389.0%5.5%(+3.52)#604.9%(+4.15)#2,227
9.303418.0%5.5%(+2.45)#784.9%(+3.07)#2,929
10.303407.0%5.5%(+1.43)#1014.9%(+2.06)#3,884
11.303296.8%5.5%(+1.29)#1074.9%(+1.92)#4,052
12.303186.4%5.5%(+0.855)#1224.9%(+1.48)#4,652
13.303636.3%5.5%(+0.739)#1314.9%(+1.37)#4,833
14.303246.2%5.5%(+0.704)#1344.9%(+1.33)#4,897
15.303156.0%5.5%(+0.529)#1464.9%(+1.16)#5,214
16.303086.0%5.5%(+0.482)#1494.9%(+1.11)#5,292
17.303125.9%5.5%(+0.388)#1524.9%(+1.01)#5,463
18.303375.6%5.5%(+0.129)#1654.9%(+0.755)#5,978
19.303495.5%5.5%(-0.058)#1754.9%(+0.569)#6,378
20.303095.4%5.5%(-0.090)#1804.9%(+0.536)#6,442
21.303275.3%5.5%(-0.227)#1954.9%(+0.399)#6,770
22.303425.2%5.5%(-0.337)#2004.9%(+0.289)#7,019
23.303315.1%5.5%(-0.456)#2074.9%(+0.170)#7,293
24.303194.9%5.5%(-0.611)#2154.9%(+0.016)#7,665
25.303164.8%5.5%(-0.685)#2194.9%(-0.058)#7,885
26.303264.6%5.5%(-0.903)#2304.9%(-0.276)#8,517
27.303064.5%5.5%(-0.977)#2354.9%(-0.350)#8,733
28.303174.3%5.5%(-1.19)#2424.9%(-0.565)#9,441
29.303504.3%5.5%(-1.25)#2454.9%(-0.619)#9,606
30.303604.2%5.5%(-1.37)#2574.9%(-0.739)#9,974
31.303454.0%5.5%(-1.52)#2594.9%(-0.897)#10,478
32.303033.8%5.5%(-1.68)#2734.9%(-1.05)#11,047
33.303053.8%5.5%(-1.76)#2814.9%(-1.13)#11,331
34.303143.4%5.5%(-2.10)#3124.9%(-1.47)#12,585
35.303073.4%5.5%(-2.16)#3164.9%(-1.53)#12,790
36.303542.8%5.5%(-2.70)#3484.9%(-2.07)#14,712
37.303442.6%5.5%(-2.93)#3694.9%(-2.31)#15,573
38.303102.1%5.5%(-3.39)#4004.9%(-2.76)#17,197
39.303111.4%5.5%(-4.10)#4554.9%(-3.47)#19,360

Common Questions

What are the Top 10 Zip Codes with the Highest Percentage of Population with a Degree in Computers and Mathematics in Atlanta, GA?
Top 10 Zip Codes with the Highest Percentage of Population with a Degree in Computers and Mathematics in Atlanta, GA are:
#1
47.6%
#2
46.2%
#3
18.4%
#4
14.1%
#5
9.6%
#6
9.2%
#7
9.1%
#8
9.0%
#9
8.0%
#10
7.0%
What zip code has the Highest Percentage of Population with a Degree in Computers and Mathematics in Atlanta, GA?
30322 has the Highest Percentage of Population with a Degree in Computers and Mathematics in Atlanta, GA with 47.6%.
What is the Percentage of Population with a Degree in Computers and Mathematics in Atlanta, GA?
Percentage of Population with a Degree in Computers and Mathematics in Atlanta is 4.9%.
What is the Percentage of Population with a Degree in Computers and Mathematics in Georgia?
Percentage of Population with a Degree in Computers and Mathematics in Georgia is 5.5%.
What is the Percentage of Population with a Degree in Computers and Mathematics in the United States?
Percentage of Population with a Degree in Computers and Mathematics in the United States is 4.9%.