Zip Codes with the Highest Percentage of Population Employed in Firefighting & Prevention in Atlanta, GA

RELATED REPORTS & OPTIONS

Firefighting & Prevention
Population
Families and Households
Female Fertility
Female Fertility (Unmarried)
Race (Community Size)
Race (Percentage)
Ancestry (Community Size)
AfghanAfricanAlbanianAmericanApacheArabArgentineanArmenianAssyrian / Chaldean / SyriacAustralianAustrianBahamianBangladeshiBarbadianBelgianBelizeanBermudanBhutaneseBlackfeetBolivianBrazilianBritishBritish West IndianBulgarianBurmeseCajunCambodianCanadianCape VerdeanCelticCentral AmericanCentral American IndianCherokeeChickasawChileanChippewaChoctawColombianCosta RicanCreekCroatianCubanCzechCzechoslovakianDanishDominicanDutchDutch West IndianEastern EuropeanEcuadorianEgyptianEnglishEstonianEthiopianEuropeanFilipinoFinnishFrenchFrench CanadianGermanGhanaianGreekGuamanian / ChamorroGuatemalanGuyaneseHaitianHonduranHungarianIcelanderIndian (Asian)IndonesianIranianIraqiIrishIroquoisIsraeliItalianJamaicanJapaneseJordanianKenyanKoreanLaotianLatvianLebaneseLiberianLithuanianLumbeeLuxembourgerMacedonianMalaysianMalteseMexicanMexican American IndianMongolianMoroccanNative HawaiianNavajoNew ZealanderNicaraguanNigerianNorthern EuropeanNorwegianOsagePakistaniPalestinianPanamanianParaguayanPennsylvania GermanPeruvianPolishPortuguesePotawatomiPuerto RicanRomanianRussianSalvadoranSamoanScandinavianScotch-IrishScottishSeminoleSenegaleseSerbianSierra LeoneanSiouxSlavicSlovakSloveneSomaliSouth AfricanSouth AmericanSouth American IndianSoviet UnionSpaniardSpanishSpanish AmericanSri LankanSubsaharan AfricanSudaneseSwedishSwissSyrianThaiTrinidadian and TobagonianTurkishU.S. Virgin IslanderUgandanUkrainianUruguayanVenezuelanVietnameseWelshWest IndianYugoslavianZimbabwean
Ancestry (Percentage)
AfghanAfricanAlbanianAmericanApacheArabArgentineanArmenianAssyrian / Chaldean / SyriacAustralianAustrianBahamianBangladeshiBarbadianBelgianBelizeanBermudanBhutaneseBlackfeetBolivianBrazilianBritishBritish West IndianBulgarianBurmeseCajunCambodianCanadianCape VerdeanCelticCentral AmericanCentral American IndianCherokeeChickasawChileanChippewaChoctawColombianCosta RicanCreekCroatianCubanCzechCzechoslovakianDanishDominicanDutchDutch West IndianEastern EuropeanEcuadorianEgyptianEnglishEstonianEthiopianEuropeanFilipinoFinnishFrenchFrench CanadianGermanGhanaianGreekGuamanian / ChamorroGuatemalanGuyaneseHaitianHonduranHungarianIcelanderIndian (Asian)IndonesianIranianIraqiIrishIroquoisIsraeliItalianJamaicanJapaneseJordanianKenyanKoreanLaotianLatvianLebaneseLiberianLithuanianLumbeeLuxembourgerMacedonianMalaysianMalteseMexicanMexican American IndianMongolianMoroccanNative HawaiianNavajoNew ZealanderNicaraguanNigerianNorthern EuropeanNorwegianOsagePakistaniPalestinianPanamanianParaguayanPennsylvania GermanPeruvianPolishPortuguesePotawatomiPuerto RicanRomanianRussianSalvadoranSamoanScandinavianScotch-IrishScottishSeminoleSenegaleseSerbianSierra LeoneanSiouxSlavicSlovakSloveneSomaliSouth AfricanSouth AmericanSouth American IndianSoviet UnionSpaniardSpanishSpanish AmericanSri LankanSubsaharan AfricanSudaneseSwedishSwissSyrianThaiTrinidadian and TobagonianTurkishU.S. Virgin IslanderUgandanUkrainianUruguayanVenezuelanVietnameseWelshWest IndianYugoslavianZimbabwean
Immigrant Origin (Total)
AfghanistanAfricaArgentinaArmeniaAsiaAustraliaAustriaBahamasBangladeshBarbadosBelarusBelgiumBelizeBoliviaBosnia and HerzegovinaBrazilBulgariaCambodiaCameroonCanadaCaribbeanCentral AmericaChileChinaColombiaCongoCosta RicaCroatiaCubaCzechoslovakiaDenmarkDominicaDominican RepublicEastern AfricaEastern AsiaEastern EuropeEcuadorEgyptEl SalvadorEnglandEritreaEthiopiaEuropeFranceGermanyGhanaGreeceGrenadaGuatemalaGuyanaHaitiHondurasHong KongHungaryIndiaIndonesiaIranIraqIrelandIsraelItalyJamaicaJapanJordanKenyaKoreaKuwaitLaosLatin AmericaLatviaLebanonLiberiaLithuaniaMalaysiaMexicoMiddle AfricaMoldovaMoroccoNepalNetherlandsNicaraguaNigeriaNorthern AfricaNorthern EuropeOceaniaPakistanPanamaPeruPhilippinesPolandPortugalRomaniaRussiaSaudi ArabiaScotlandSenegalSerbiaSierra LeoneSingaporeSouth AfricaSouth AmericaSouth Central AsiaSouth Eastern AsiaSouthern EuropeSpainSri LankaSt. Vincent and the GrenadinesSudanSwedenSwitzerlandSyriaTaiwanThailandTrinidad and TobagoTurkeyUgandaUkraineUruguayUzbekistanVenezuelaVietnamWest IndiesWestern AfricaWestern AsiaWestern EuropeZaireZimbabwe
Immigrant Origin (Percentage)
AfghanistanAfricaArgentinaArmeniaAsiaAustraliaAustriaBahamasBangladeshBarbadosBelarusBelgiumBelizeBoliviaBosnia and HerzegovinaBrazilBulgariaCambodiaCameroonCanadaCaribbeanCentral AmericaChileChinaColombiaCongoCosta RicaCroatiaCubaCzechoslovakiaDenmarkDominicaDominican RepublicEastern AfricaEastern AsiaEastern EuropeEcuadorEgyptEl SalvadorEnglandEritreaEthiopiaEuropeFranceGermanyGhanaGreeceGrenadaGuatemalaGuyanaHaitiHondurasHong KongHungaryIndiaIndonesiaIranIraqIrelandIsraelItalyJamaicaJapanJordanKenyaKoreaKuwaitLaosLatin AmericaLatviaLebanonLiberiaLithuaniaMalaysiaMexicoMiddle AfricaMoldovaMoroccoNepalNetherlandsNicaraguaNigeriaNorthern AfricaNorthern EuropeOceaniaPakistanPanamaPeruPhilippinesPolandPortugalRomaniaRussiaSaudi ArabiaScotlandSenegalSerbiaSierra LeoneSingaporeSouth AfricaSouth AmericaSouth Central AsiaSouth Eastern AsiaSouthern EuropeSpainSri LankaSt. Vincent and the GrenadinesSudanSwedenSwitzerlandSyriaTaiwanThailandTrinidad and TobagoTurkeyUgandaUkraineUruguayUzbekistanVenezuelaVietnamWest IndiesWestern AfricaWestern AsiaWestern EuropeZaireZimbabwe
Income
Income (Families)
Income (Households)
Poverty
Poverty (Families)
Unemployment
Employment Occupations
Employment Industries
Employer Class
Commute Time
Commute Means
School Enrollment
Education by Degree Field
Occupancy
Finances
Physical Characteristics
Atlanta
Compare Zip Codes
Comparison Subject

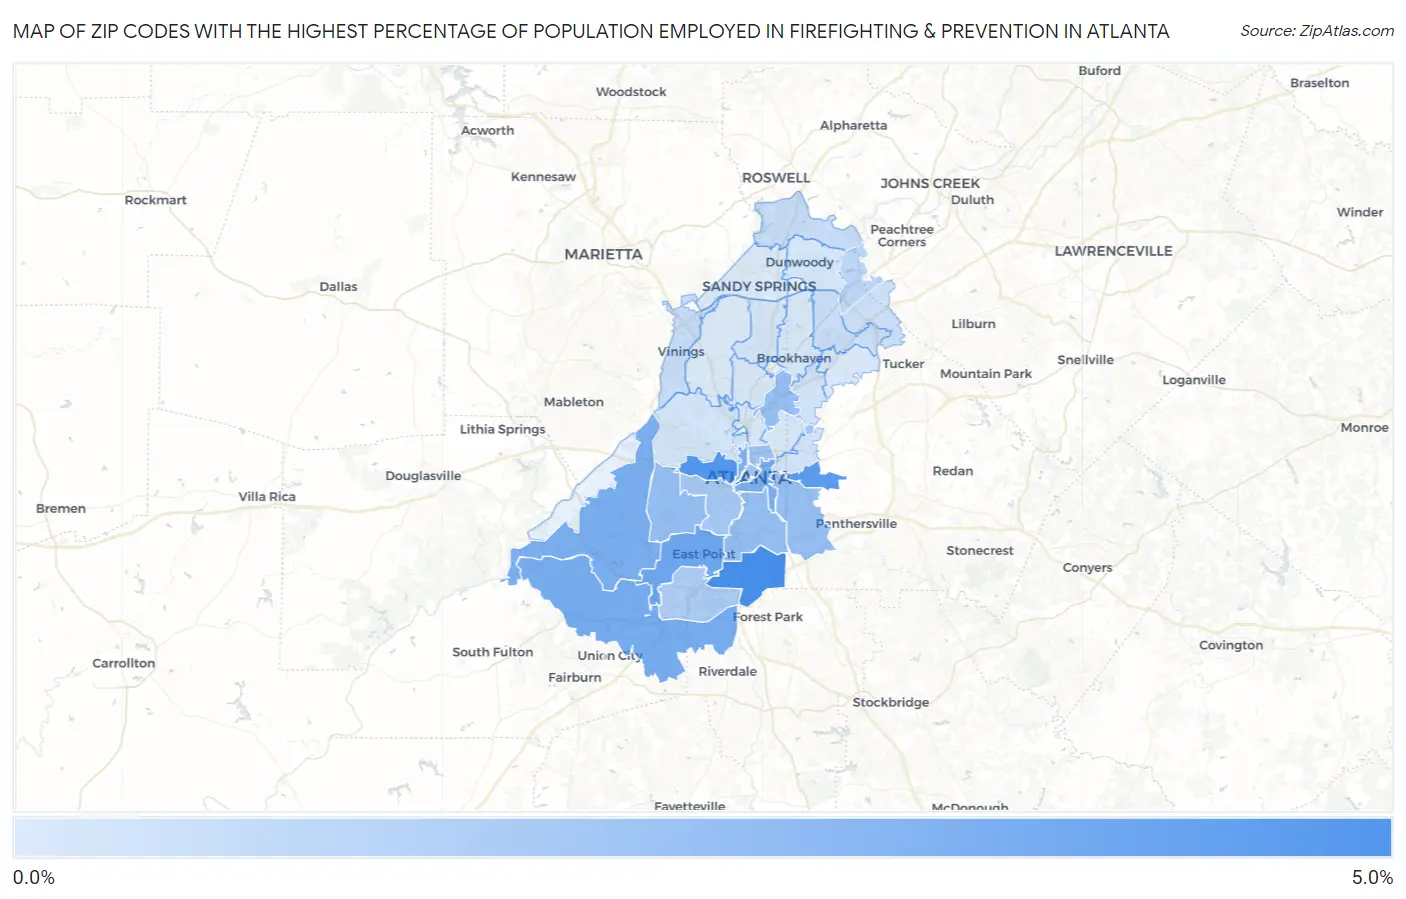
Map of Zip Codes with the Highest Percentage of Population Employed in Firefighting & Prevention in Atlanta

0.0%
5.0%
Zip Codes with the Highest Percentage of Population Employed in Firefighting & Prevention in Atlanta Map

Zip Codes with the Highest Percentage of Population Employed in Firefighting & Prevention in Atlanta, GA

Zip Code % Employed vs State vs National
1.303544.8%1.2%(+3.58)#161.2%(+3.59)#997
2.303144.4%1.2%(+3.18)#211.2%(+3.19)#1,163
3.303174.1%1.2%(+2.95)#241.2%(+2.96)#1,282
4.303443.5%1.2%(+2.35)#351.2%(+2.36)#1,683
5.303493.2%1.2%(+2.01)#451.2%(+2.02)#2,016
6.303313.1%1.2%(+1.89)#541.2%(+1.90)#2,142
7.303123.1%1.2%(+1.89)#551.2%(+1.90)#2,144
8.303133.0%1.2%(+1.78)#611.2%(+1.79)#2,277
9.303112.3%1.2%(+1.10)#901.2%(+1.11)#3,563
10.303152.3%1.2%(+1.07)#931.2%(+1.08)#3,672
11.303242.2%1.2%(+1.03)#961.2%(+1.04)#3,783
12.303162.2%1.2%(+1.01)#1001.2%(+1.02)#3,836
13.303082.0%1.2%(+0.835)#1181.2%(+0.844)#4,404
14.303031.9%1.2%(+0.695)#1351.2%(+0.703)#4,960
15.303221.9%1.2%(+0.660)#1421.2%(+0.669)#5,116
16.303101.7%1.2%(+0.542)#1551.2%(+0.551)#5,643
17.303371.5%1.2%(+0.329)#1901.2%(+0.338)#6,828
18.303601.0%1.2%(-0.147)#2921.2%(-0.139)#10,621
19.303321.0%1.2%(-0.176)#2961.2%(-0.167)#10,887
20.303390.71%1.2%(-0.488)#3601.2%(-0.479)#14,256
21.303500.66%1.2%(-0.539)#3711.2%(-0.531)#14,843
22.303410.61%1.2%(-0.584)#3841.2%(-0.575)#15,312
23.303400.47%1.2%(-0.727)#4251.2%(-0.718)#16,911
24.303290.43%1.2%(-0.764)#4351.2%(-0.756)#17,326
25.303070.38%1.2%(-0.814)#4511.2%(-0.805)#17,881
26.303180.35%1.2%(-0.840)#4581.2%(-0.832)#18,178
27.303380.27%1.2%(-0.923)#4811.2%(-0.914)#19,050
28.303420.22%1.2%(-0.970)#4921.2%(-0.962)#19,464
29.303450.20%1.2%(-0.994)#4981.2%(-0.986)#19,680
30.303190.19%1.2%(-1.01)#5011.2%(-0.998)#19,773
31.303050.16%1.2%(-1.03)#5081.2%(-1.02)#19,943
32.303060.15%1.2%(-1.05)#5111.2%(-1.04)#20,035
33.303090.13%1.2%(-1.06)#5181.2%(-1.05)#20,149
34.303280.051%1.2%(-1.14)#5301.2%(-1.13)#20,506
35.303270.043%1.2%(-1.15)#5321.2%(-1.14)#20,523

Common Questions

What are the Top 10 Zip Codes with the Highest Percentage of Population Employed in Firefighting & Prevention in Atlanta, GA?
Top 10 Zip Codes with the Highest Percentage of Population Employed in Firefighting & Prevention in Atlanta, GA are:
#1
4.8%
#2
4.4%
#3
4.1%
#4
3.5%
#5
3.2%
#6
3.1%
#7
3.1%
#8
3.0%
#9
2.3%
#10
2.3%
What zip code has the Highest Percentage of Population Employed in Firefighting & Prevention in Atlanta, GA?
30354 has the Highest Percentage of Population Employed in Firefighting & Prevention in Atlanta, GA with 4.8%.
What is the Percentage of Population Employed in Firefighting & Prevention in Atlanta, GA?
Percentage of Population Employed in Firefighting & Prevention in Atlanta is 1.7%.
What is the Percentage of Population Employed in Firefighting & Prevention in Georgia?
Percentage of Population Employed in Firefighting & Prevention in Georgia is 1.2%.
What is the Percentage of Population Employed in Firefighting & Prevention in the United States?
Percentage of Population Employed in Firefighting & Prevention in the United States is 1.2%.