Zip Codes with the Highest Percentage of Population Employed in Arts, Media & Entertainment in Atlanta, GA

RELATED REPORTS & OPTIONS

Arts, Media & Entertainment
Population
Families and Households
Female Fertility
Female Fertility (Unmarried)
Race (Community Size)
Race (Percentage)
Ancestry (Community Size)
AfghanAfricanAlbanianAmericanApacheArabArgentineanArmenianAssyrian / Chaldean / SyriacAustralianAustrianBahamianBangladeshiBarbadianBelgianBelizeanBermudanBhutaneseBlackfeetBolivianBrazilianBritishBritish West IndianBulgarianBurmeseCajunCambodianCanadianCape VerdeanCelticCentral AmericanCentral American IndianCherokeeChickasawChileanChippewaChoctawColombianCosta RicanCreekCroatianCubanCzechCzechoslovakianDanishDominicanDutchDutch West IndianEastern EuropeanEcuadorianEgyptianEnglishEstonianEthiopianEuropeanFilipinoFinnishFrenchFrench CanadianGermanGhanaianGreekGuamanian / ChamorroGuatemalanGuyaneseHaitianHonduranHungarianIcelanderIndian (Asian)IndonesianIranianIraqiIrishIroquoisIsraeliItalianJamaicanJapaneseJordanianKenyanKoreanLaotianLatvianLebaneseLiberianLithuanianLumbeeLuxembourgerMacedonianMalaysianMalteseMexicanMexican American IndianMongolianMoroccanNative HawaiianNavajoNew ZealanderNicaraguanNigerianNorthern EuropeanNorwegianOsagePakistaniPalestinianPanamanianParaguayanPennsylvania GermanPeruvianPolishPortuguesePotawatomiPuerto RicanRomanianRussianSalvadoranSamoanScandinavianScotch-IrishScottishSeminoleSenegaleseSerbianSierra LeoneanSiouxSlavicSlovakSloveneSomaliSouth AfricanSouth AmericanSouth American IndianSoviet UnionSpaniardSpanishSpanish AmericanSri LankanSubsaharan AfricanSudaneseSwedishSwissSyrianThaiTrinidadian and TobagonianTurkishU.S. Virgin IslanderUgandanUkrainianUruguayanVenezuelanVietnameseWelshWest IndianYugoslavianZimbabwean
Ancestry (Percentage)
AfghanAfricanAlbanianAmericanApacheArabArgentineanArmenianAssyrian / Chaldean / SyriacAustralianAustrianBahamianBangladeshiBarbadianBelgianBelizeanBermudanBhutaneseBlackfeetBolivianBrazilianBritishBritish West IndianBulgarianBurmeseCajunCambodianCanadianCape VerdeanCelticCentral AmericanCentral American IndianCherokeeChickasawChileanChippewaChoctawColombianCosta RicanCreekCroatianCubanCzechCzechoslovakianDanishDominicanDutchDutch West IndianEastern EuropeanEcuadorianEgyptianEnglishEstonianEthiopianEuropeanFilipinoFinnishFrenchFrench CanadianGermanGhanaianGreekGuamanian / ChamorroGuatemalanGuyaneseHaitianHonduranHungarianIcelanderIndian (Asian)IndonesianIranianIraqiIrishIroquoisIsraeliItalianJamaicanJapaneseJordanianKenyanKoreanLaotianLatvianLebaneseLiberianLithuanianLumbeeLuxembourgerMacedonianMalaysianMalteseMexicanMexican American IndianMongolianMoroccanNative HawaiianNavajoNew ZealanderNicaraguanNigerianNorthern EuropeanNorwegianOsagePakistaniPalestinianPanamanianParaguayanPennsylvania GermanPeruvianPolishPortuguesePotawatomiPuerto RicanRomanianRussianSalvadoranSamoanScandinavianScotch-IrishScottishSeminoleSenegaleseSerbianSierra LeoneanSiouxSlavicSlovakSloveneSomaliSouth AfricanSouth AmericanSouth American IndianSoviet UnionSpaniardSpanishSpanish AmericanSri LankanSubsaharan AfricanSudaneseSwedishSwissSyrianThaiTrinidadian and TobagonianTurkishU.S. Virgin IslanderUgandanUkrainianUruguayanVenezuelanVietnameseWelshWest IndianYugoslavianZimbabwean
Immigrant Origin (Total)
AfghanistanAfricaArgentinaArmeniaAsiaAustraliaAustriaBahamasBangladeshBarbadosBelarusBelgiumBelizeBoliviaBosnia and HerzegovinaBrazilBulgariaCambodiaCameroonCanadaCaribbeanCentral AmericaChileChinaColombiaCongoCosta RicaCroatiaCubaCzechoslovakiaDenmarkDominicaDominican RepublicEastern AfricaEastern AsiaEastern EuropeEcuadorEgyptEl SalvadorEnglandEritreaEthiopiaEuropeFranceGermanyGhanaGreeceGrenadaGuatemalaGuyanaHaitiHondurasHong KongHungaryIndiaIndonesiaIranIraqIrelandIsraelItalyJamaicaJapanJordanKenyaKoreaKuwaitLaosLatin AmericaLatviaLebanonLiberiaLithuaniaMalaysiaMexicoMiddle AfricaMoldovaMoroccoNepalNetherlandsNicaraguaNigeriaNorthern AfricaNorthern EuropeOceaniaPakistanPanamaPeruPhilippinesPolandPortugalRomaniaRussiaSaudi ArabiaScotlandSenegalSerbiaSierra LeoneSingaporeSouth AfricaSouth AmericaSouth Central AsiaSouth Eastern AsiaSouthern EuropeSpainSri LankaSt. Vincent and the GrenadinesSudanSwedenSwitzerlandSyriaTaiwanThailandTrinidad and TobagoTurkeyUgandaUkraineUruguayUzbekistanVenezuelaVietnamWest IndiesWestern AfricaWestern AsiaWestern EuropeZaireZimbabwe
Immigrant Origin (Percentage)
AfghanistanAfricaArgentinaArmeniaAsiaAustraliaAustriaBahamasBangladeshBarbadosBelarusBelgiumBelizeBoliviaBosnia and HerzegovinaBrazilBulgariaCambodiaCameroonCanadaCaribbeanCentral AmericaChileChinaColombiaCongoCosta RicaCroatiaCubaCzechoslovakiaDenmarkDominicaDominican RepublicEastern AfricaEastern AsiaEastern EuropeEcuadorEgyptEl SalvadorEnglandEritreaEthiopiaEuropeFranceGermanyGhanaGreeceGrenadaGuatemalaGuyanaHaitiHondurasHong KongHungaryIndiaIndonesiaIranIraqIrelandIsraelItalyJamaicaJapanJordanKenyaKoreaKuwaitLaosLatin AmericaLatviaLebanonLiberiaLithuaniaMalaysiaMexicoMiddle AfricaMoldovaMoroccoNepalNetherlandsNicaraguaNigeriaNorthern AfricaNorthern EuropeOceaniaPakistanPanamaPeruPhilippinesPolandPortugalRomaniaRussiaSaudi ArabiaScotlandSenegalSerbiaSierra LeoneSingaporeSouth AfricaSouth AmericaSouth Central AsiaSouth Eastern AsiaSouthern EuropeSpainSri LankaSt. Vincent and the GrenadinesSudanSwedenSwitzerlandSyriaTaiwanThailandTrinidad and TobagoTurkeyUgandaUkraineUruguayUzbekistanVenezuelaVietnamWest IndiesWestern AfricaWestern AsiaWestern EuropeZaireZimbabwe
Income
Income (Families)
Income (Households)
Poverty
Poverty (Families)
Unemployment
Employment Occupations
Employment Industries
Employer Class
Commute Time
Commute Means
School Enrollment
Education by Degree Field
Occupancy
Finances
Physical Characteristics
Atlanta
Compare Zip Codes
Comparison Subject

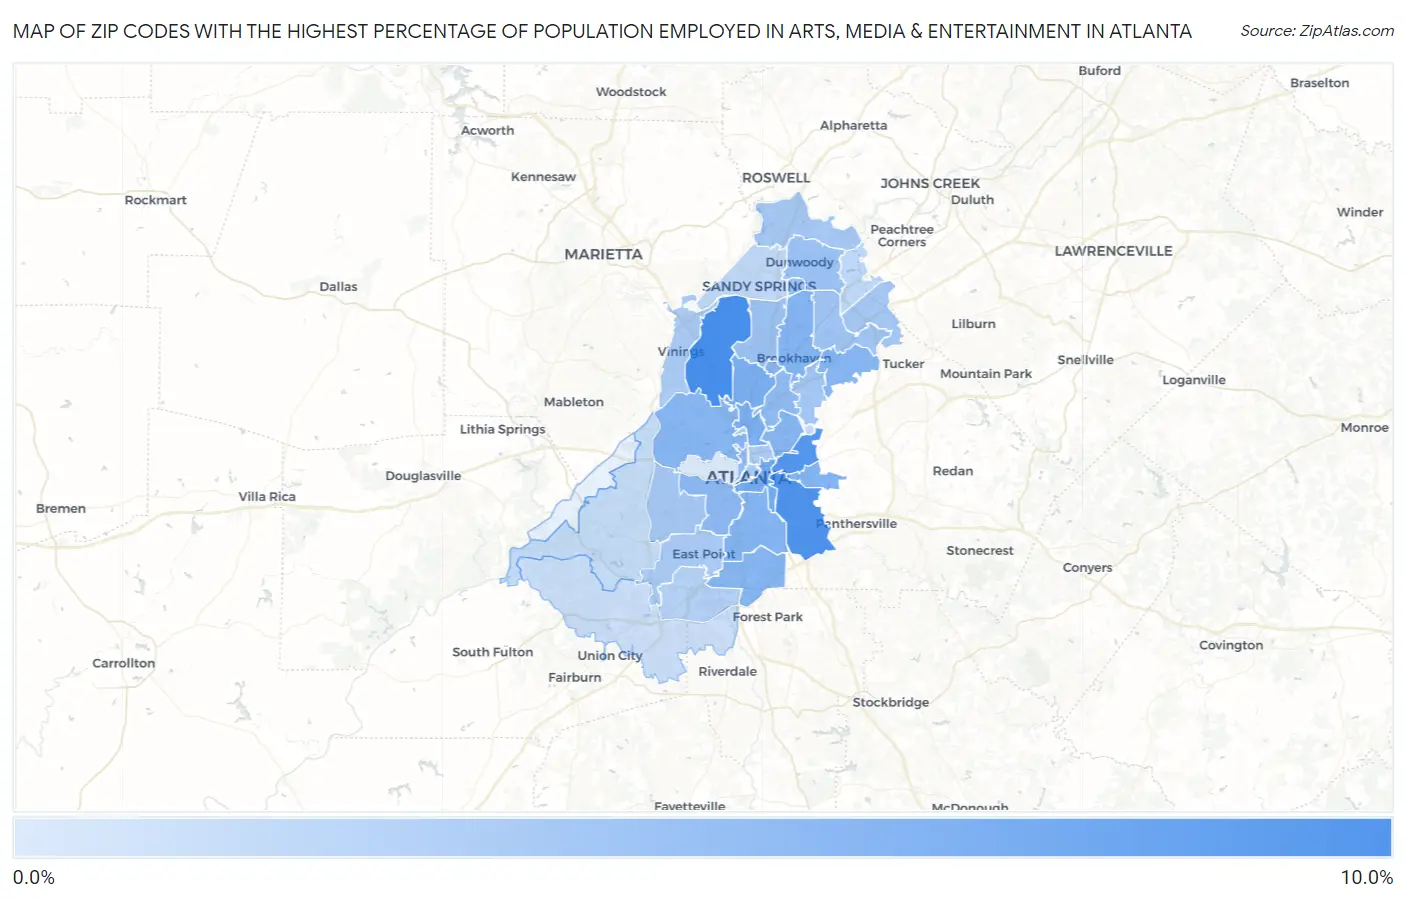
Map of Zip Codes with the Highest Percentage of Population Employed in Arts, Media & Entertainment in Atlanta

0.0%
10.0%
Zip Codes with the Highest Percentage of Population Employed in Arts, Media & Entertainment in Atlanta Map

Zip Codes with the Highest Percentage of Population Employed in Arts, Media & Entertainment in Atlanta, GA

Zip Code % Employed vs State vs National
1.303278.3%2.0%(+6.37)#42.1%(+6.27)#512
2.303167.9%2.0%(+5.97)#72.1%(+5.87)#562
3.303077.6%2.0%(+5.65)#82.1%(+5.55)#622
4.303125.9%2.0%(+3.98)#152.1%(+3.87)#1,059
5.303095.6%2.0%(+3.62)#192.1%(+3.52)#1,208
6.303055.5%2.0%(+3.57)#202.1%(+3.47)#1,231
7.303175.2%2.0%(+3.23)#232.1%(+3.13)#1,405
8.303155.1%2.0%(+3.16)#242.1%(+3.05)#1,436
9.303455.0%2.0%(+3.08)#252.1%(+2.97)#1,482
10.303195.0%2.0%(+3.07)#262.1%(+2.97)#1,484
11.303185.0%2.0%(+3.03)#282.1%(+2.93)#1,508
12.303545.0%2.0%(+3.01)#292.1%(+2.91)#1,517
13.303264.9%2.0%(+2.98)#302.1%(+2.87)#1,540
14.303064.9%2.0%(+2.97)#332.1%(+2.87)#1,547
15.303104.7%2.0%(+2.72)#352.1%(+2.61)#1,710
16.303134.6%2.0%(+2.61)#362.1%(+2.50)#1,806
17.303244.5%2.0%(+2.52)#372.1%(+2.41)#1,876
18.303424.0%2.0%(+2.07)#472.1%(+1.97)#2,335
19.303464.0%2.0%(+2.03)#482.1%(+1.93)#2,375
20.303383.9%2.0%(+1.93)#542.1%(+1.82)#2,516
21.303413.7%2.0%(+1.73)#602.1%(+1.62)#2,788
22.303293.6%2.0%(+1.64)#642.1%(+1.54)#2,907
23.303033.5%2.0%(+1.52)#672.1%(+1.42)#3,094
24.303503.5%2.0%(+1.51)#682.1%(+1.41)#3,109
25.303403.4%2.0%(+1.46)#712.1%(+1.36)#3,190
26.303113.4%2.0%(+1.45)#722.1%(+1.35)#3,218
27.303633.3%2.0%(+1.30)#772.1%(+1.20)#3,490
28.303393.2%2.0%(+1.25)#792.1%(+1.15)#3,583
29.303443.2%2.0%(+1.20)#812.1%(+1.09)#3,725
30.303083.1%2.0%(+1.15)#862.1%(+1.04)#3,844
31.303322.9%2.0%(+0.893)#1032.1%(+0.790)#4,473
32.303372.6%2.0%(+0.640)#1182.1%(+0.538)#5,238
33.303602.2%2.0%(+0.196)#1582.1%(+0.093)#7,031
34.303282.0%2.0%(+0.070)#1742.1%(-0.033)#7,659
35.303222.0%2.0%(+0.065)#1772.1%(-0.037)#7,687
36.303311.8%2.0%(-0.119)#1952.1%(-0.221)#8,737
37.303491.5%2.0%(-0.413)#2442.1%(-0.516)#10,690
38.303140.67%2.0%(-1.29)#3902.1%(-1.39)#17,482

Common Questions

What are the Top 10 Zip Codes with the Highest Percentage of Population Employed in Arts, Media & Entertainment in Atlanta, GA?
Top 10 Zip Codes with the Highest Percentage of Population Employed in Arts, Media & Entertainment in Atlanta, GA are:
#1
8.3%
#2
7.9%
#3
7.6%
#4
5.9%
#5
5.6%
#6
5.5%
#7
5.2%
#8
5.1%
#9
5.0%
#10
5.0%
What zip code has the Highest Percentage of Population Employed in Arts, Media & Entertainment in Atlanta, GA?
30327 has the Highest Percentage of Population Employed in Arts, Media & Entertainment in Atlanta, GA with 8.3%.
What is the Percentage of Population Employed in Arts, Media & Entertainment in Atlanta, GA?
Percentage of Population Employed in Arts, Media & Entertainment in Atlanta is 4.8%.
What is the Percentage of Population Employed in Arts, Media & Entertainment in Georgia?
Percentage of Population Employed in Arts, Media & Entertainment in Georgia is 2.0%.
What is the Percentage of Population Employed in Arts, Media & Entertainment in the United States?
Percentage of Population Employed in Arts, Media & Entertainment in the United States is 2.1%.