Zip Codes with the Highest Percentage of Population Employed in Architecture & Engineering in Buford, GA
RELATED REPORTS & OPTIONS
Architecture & Engineering
Buford
Compare Zip Codes
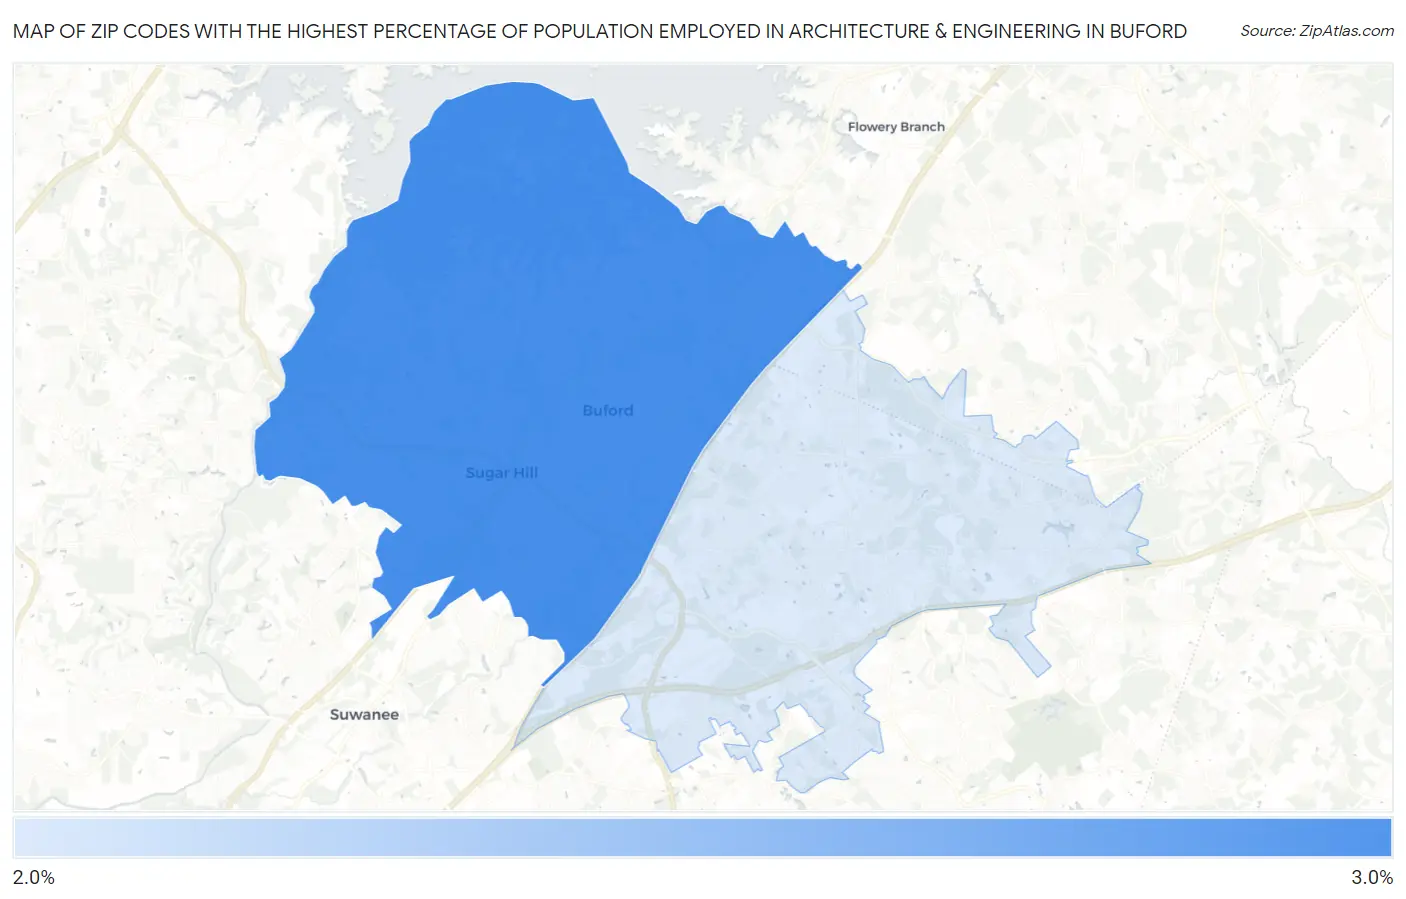
Map of Zip Codes with the Highest Percentage of Population Employed in Architecture & Engineering in Buford
2.1%
2.9%
Zip Codes with the Highest Percentage of Population Employed in Architecture & Engineering in Buford, GA
| Zip Code | % Employed | vs State | vs National | |
| 1. | 30518 | 2.9% | 1.8%(+1.11)#90 | 2.1%(+0.754)#5,412 |
| 2. | 30519 | 2.1% | 1.8%(+0.261)#181 | 2.1%(-0.094)#9,292 |
1
Common Questions
What are the Top Zip Codes with the Highest Percentage of Population Employed in Architecture & Engineering in Buford, GA?
Top Zip Codes with the Highest Percentage of Population Employed in Architecture & Engineering in Buford, GA are:
What zip code has the Highest Percentage of Population Employed in Architecture & Engineering in Buford, GA?
30518 has the Highest Percentage of Population Employed in Architecture & Engineering in Buford, GA with 2.9%.
What is the Percentage of Population Employed in Architecture & Engineering in Buford, GA?
Percentage of Population Employed in Architecture & Engineering in Buford is 0.85%.
What is the Percentage of Population Employed in Architecture & Engineering in Georgia?
Percentage of Population Employed in Architecture & Engineering in Georgia is 1.8%.
What is the Percentage of Population Employed in Architecture & Engineering in the United States?
Percentage of Population Employed in Architecture & Engineering in the United States is 2.1%.