Zip Codes with the Highest Percentage of Population Employed in Architecture & Engineering in Alpharetta, GA
RELATED REPORTS & OPTIONS
Architecture & Engineering
Alpharetta
Compare Zip Codes
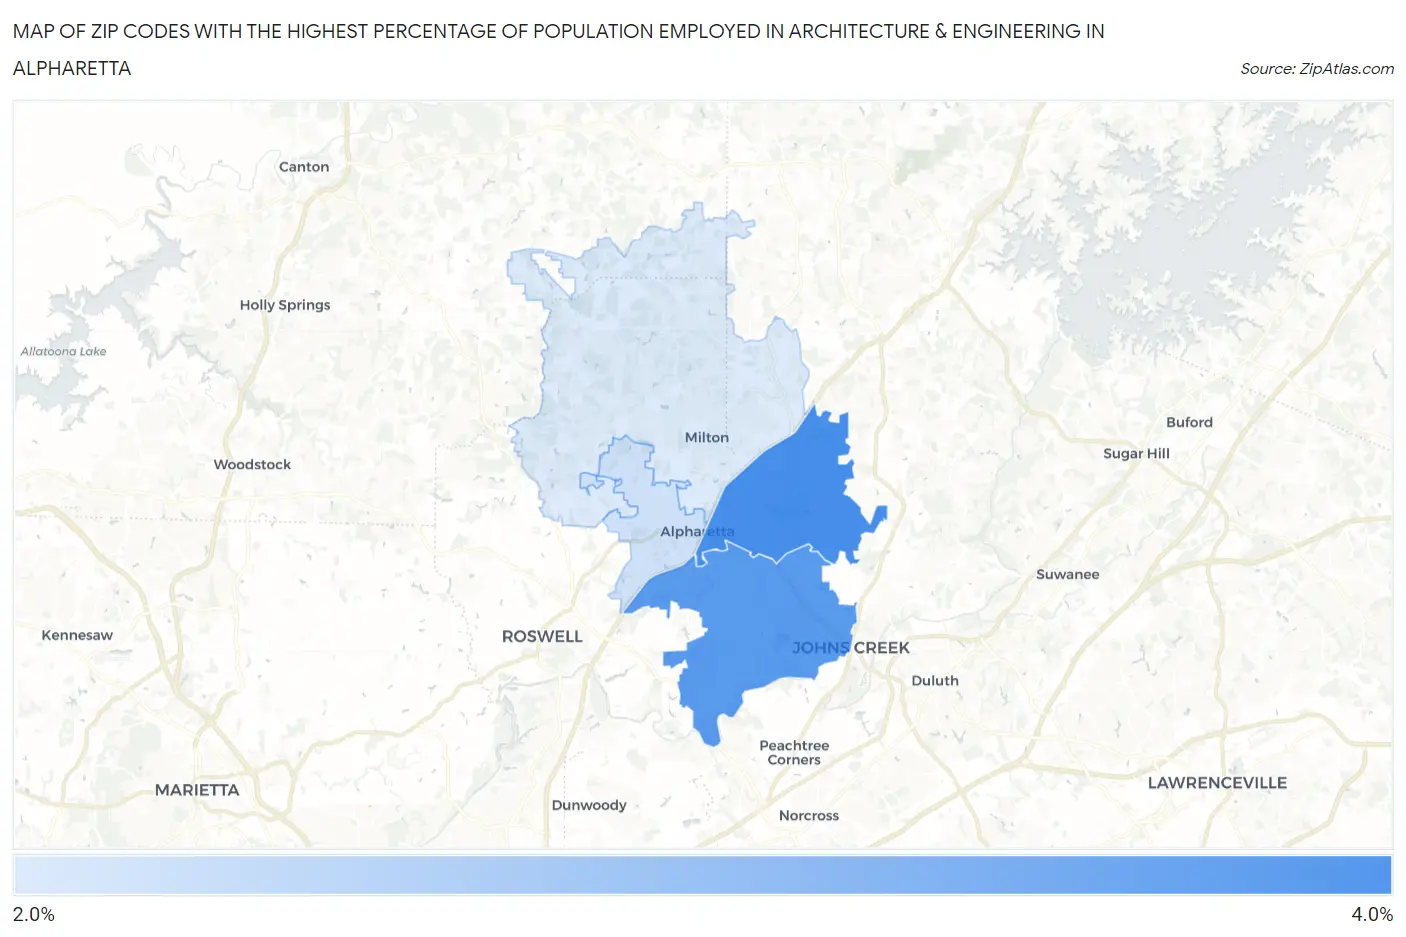
Map of Zip Codes with the Highest Percentage of Population Employed in Architecture & Engineering in Alpharetta
2.3%
3.1%
Zip Codes with the Highest Percentage of Population Employed in Architecture & Engineering in Alpharetta, GA
| Zip Code | % Employed | vs State | vs National | |
| 1. | 30005 | 3.1% | 1.8%(+1.33)#72 | 2.1%(+0.973)#4,688 |
| 2. | 30022 | 3.0% | 1.8%(+1.23)#80 | 2.1%(+0.876)#4,972 |
| 3. | 30009 | 2.3% | 1.8%(+0.548)#141 | 2.1%(+0.193)#7,751 |
| 4. | 30004 | 2.3% | 1.8%(+0.476)#152 | 2.1%(+0.121)#8,098 |
1
Common Questions
What are the Top 3 Zip Codes with the Highest Percentage of Population Employed in Architecture & Engineering in Alpharetta, GA?
Top 3 Zip Codes with the Highest Percentage of Population Employed in Architecture & Engineering in Alpharetta, GA are:
What zip code has the Highest Percentage of Population Employed in Architecture & Engineering in Alpharetta, GA?
30005 has the Highest Percentage of Population Employed in Architecture & Engineering in Alpharetta, GA with 3.1%.
What is the Percentage of Population Employed in Architecture & Engineering in Alpharetta, GA?
Percentage of Population Employed in Architecture & Engineering in Alpharetta is 2.9%.
What is the Percentage of Population Employed in Architecture & Engineering in Georgia?
Percentage of Population Employed in Architecture & Engineering in Georgia is 1.8%.
What is the Percentage of Population Employed in Architecture & Engineering in the United States?
Percentage of Population Employed in Architecture & Engineering in the United States is 2.1%.