Zip Codes with the Highest Percentage of Households Without a Vehicle in Atlanta, GA
RELATED REPORTS & OPTIONS
Households without a Cars
Atlanta
Compare Zip Codes
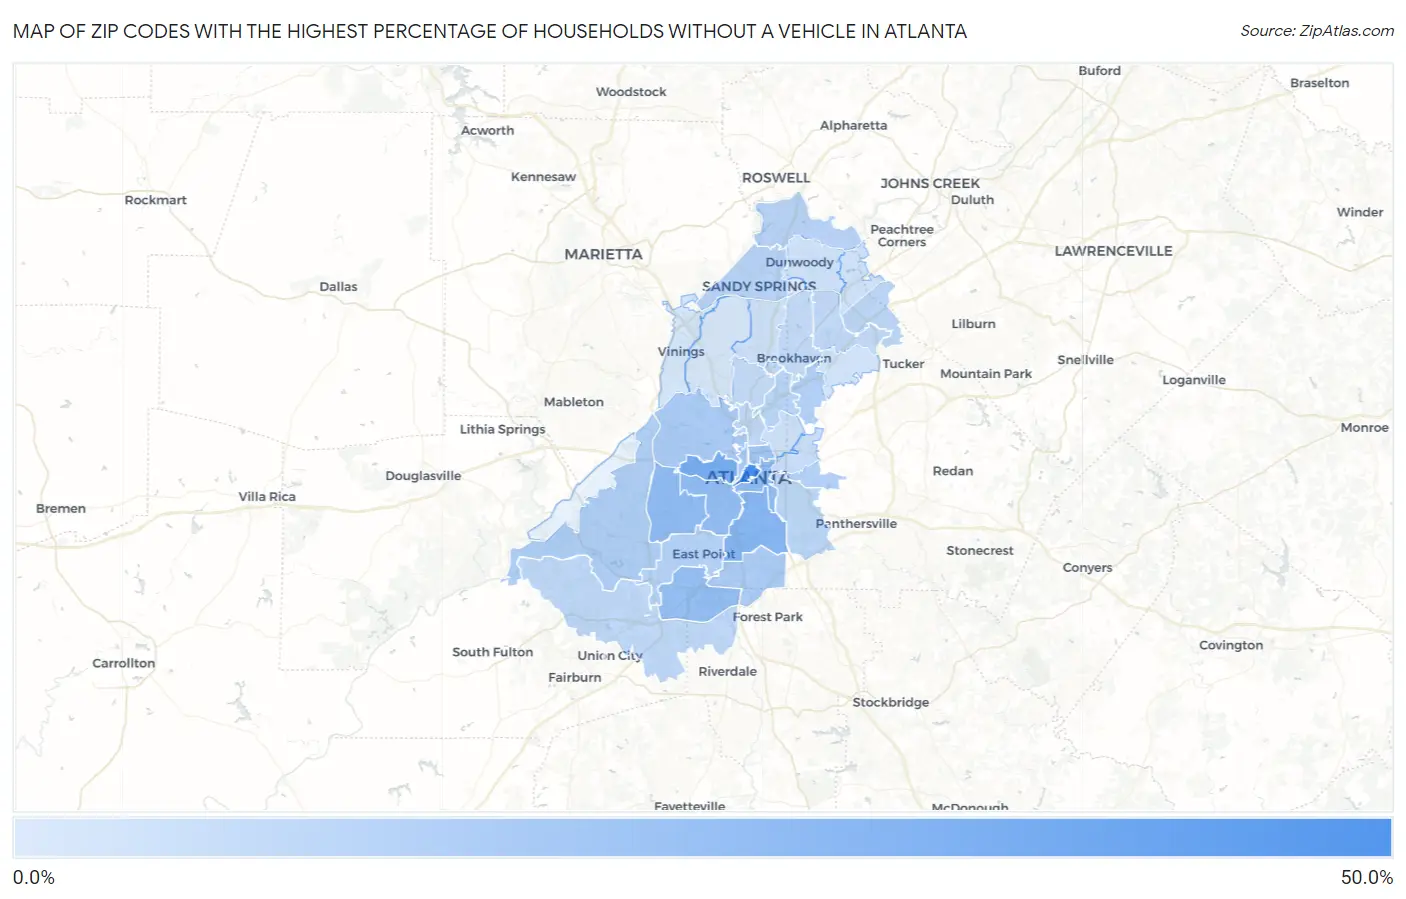
Map of Zip Codes with the Highest Percentage of Households Without a Vehicle in Atlanta
0.40%
49.9%
Zip Codes with the Highest Percentage of Households Without a Vehicle in Atlanta, GA
| Zip Code | Housholds Without a Car | vs State | vs National | |
| 1. | 30303 | 49.9% | 6.0%(+43.9)#5 | 8.3%(+41.6)#348 |
| 2. | 30314 | 31.9% | 6.0%(+25.9)#9 | 8.3%(+23.6)#729 |
| 3. | 30315 | 26.5% | 6.0%(+20.5)#13 | 8.3%(+18.2)#968 |
| 4. | 30312 | 23.4% | 6.0%(+17.4)#18 | 8.3%(+15.1)#1,182 |
| 5. | 30311 | 22.8% | 6.0%(+16.8)#22 | 8.3%(+14.5)#1,230 |
| 6. | 30310 | 22.6% | 6.0%(+16.6)#23 | 8.3%(+14.3)#1,250 |
| 7. | 30337 | 21.9% | 6.0%(+15.9)#24 | 8.3%(+13.6)#1,306 |
| 8. | 30308 | 18.2% | 6.0%(+12.2)#30 | 8.3%(+9.90)#1,749 |
| 9. | 30313 | 16.5% | 6.0%(+10.5)#41 | 8.3%(+8.20)#2,060 |
| 10. | 30318 | 15.1% | 6.0%(+9.10)#47 | 8.3%(+6.80)#2,350 |
| 11. | 30354 | 14.4% | 6.0%(+8.40)#48 | 8.3%(+6.10)#2,554 |
| 12. | 30331 | 13.3% | 6.0%(+7.30)#54 | 8.3%(+5.00)#2,953 |
| 13. | 30329 | 12.5% | 6.0%(+6.50)#65 | 8.3%(+4.20)#3,315 |
| 14. | 30317 | 12.1% | 6.0%(+6.10)#73 | 8.3%(+3.80)#3,515 |
| 15. | 30344 | 11.7% | 6.0%(+5.70)#82 | 8.3%(+3.40)#3,711 |
| 16. | 30328 | 10.6% | 6.0%(+4.60)#102 | 8.3%(+2.30)#4,381 |
| 17. | 30350 | 10.6% | 6.0%(+4.60)#103 | 8.3%(+2.30)#4,382 |
| 18. | 30324 | 10.2% | 6.0%(+4.20)#112 | 8.3%(+1.90)#4,703 |
| 19. | 30363 | 9.8% | 6.0%(+3.80)#121 | 8.3%(+1.50)#5,060 |
| 20. | 30316 | 9.6% | 6.0%(+3.60)#129 | 8.3%(+1.30)#5,189 |
| 21. | 30340 | 9.2% | 6.0%(+3.20)#135 | 8.3%(+0.900)#5,522 |
| 22. | 30349 | 9.0% | 6.0%(+3.00)#139 | 8.3%(+0.700)#5,716 |
| 23. | 30309 | 8.9% | 6.0%(+2.90)#146 | 8.3%(+0.600)#5,840 |
| 24. | 30326 | 8.3% | 6.0%(+2.30)#171 | 8.3%(=0.000)#6,575 |
| 25. | 30341 | 8.2% | 6.0%(+2.20)#173 | 8.3%(-0.100)#6,652 |
| 26. | 30319 | 7.7% | 6.0%(+1.70)#191 | 8.3%(-0.600)#7,357 |
| 27. | 30305 | 7.7% | 6.0%(+1.70)#192 | 8.3%(-0.600)#7,384 |
| 28. | 30307 | 6.4% | 6.0%(+0.400)#246 | 8.3%(-1.90)#9,598 |
| 29. | 30360 | 4.4% | 6.0%(-1.60)#341 | 8.3%(-3.90)#14,541 |
| 30. | 30342 | 4.0% | 6.0%(-2.00)#365 | 8.3%(-4.30)#15,711 |
| 31. | 30338 | 3.9% | 6.0%(-2.10)#372 | 8.3%(-4.40)#15,995 |
| 32. | 30306 | 3.9% | 6.0%(-2.10)#375 | 8.3%(-4.40)#16,030 |
| 33. | 30345 | 3.7% | 6.0%(-2.30)#390 | 8.3%(-4.60)#16,687 |
| 34. | 30339 | 2.5% | 6.0%(-3.50)#499 | 8.3%(-5.80)#20,736 |
| 35. | 30327 | 2.5% | 6.0%(-3.50)#500 | 8.3%(-5.80)#20,755 |
| 36. | 30346 | 0.40% | 6.0%(-5.60)#642 | 8.3%(-7.90)#27,029 |
1
Common Questions
What are the Top 10 Zip Codes with the Highest Percentage of Households Without a Vehicle in Atlanta, GA?
Top 10 Zip Codes with the Highest Percentage of Households Without a Vehicle in Atlanta, GA are:
What zip code has the Highest Percentage of Households Without a Vehicle in Atlanta, GA?
30303 has the Highest Percentage of Households Without a Vehicle in Atlanta, GA with 49.9%.
What is the Percentage of Households Without a Vehicle in Atlanta, GA?
Percentage of Households Without a Vehicle in Atlanta is 15.3%.
What is the Percentage of Households Without a Vehicle in Georgia?
Percentage of Households Without a Vehicle in Georgia is 6.0%.
What is the Percentage of Households Without a Vehicle in the United States?
Percentage of Households Without a Vehicle in the United States is 8.3%.