Zip Codes with the Highest Percentage of Population Employed in Health Diagnosing & Treating in Atlanta, GA
RELATED REPORTS & OPTIONS
Health Diagnosing & Treating
Atlanta
Compare Zip Codes
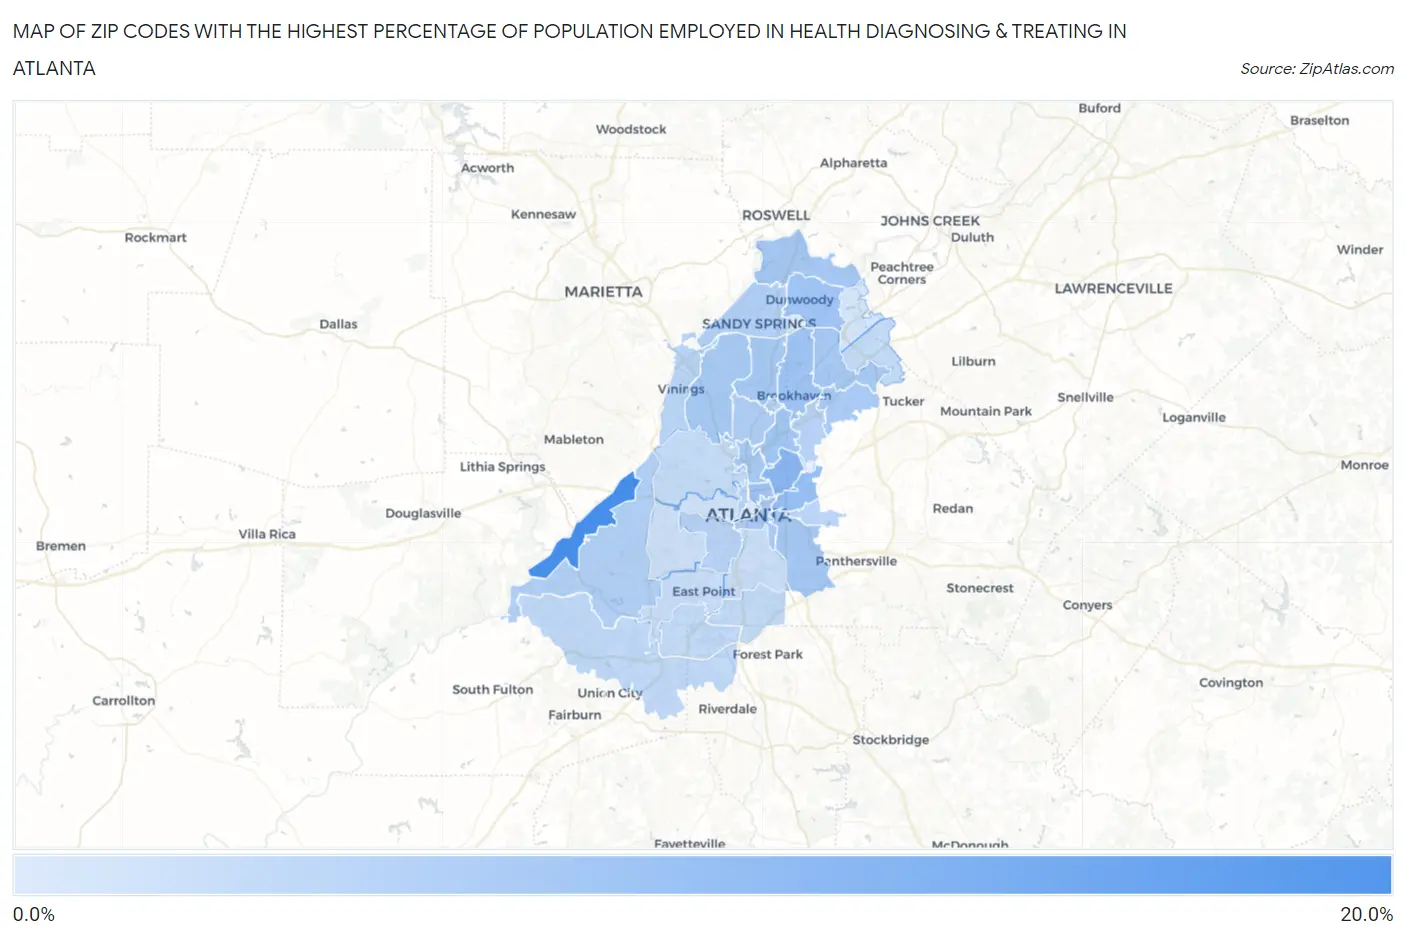
Map of Zip Codes with the Highest Percentage of Population Employed in Health Diagnosing & Treating in Atlanta
1.4%
17.1%
Zip Codes with the Highest Percentage of Population Employed in Health Diagnosing & Treating in Atlanta, GA
| Zip Code | % Employed | vs State | vs National | |
| 1. | 30336 | 17.1% | 5.7%(+11.4)#17 | 6.2%(+10.8)#806 |
| 2. | 30306 | 9.8% | 5.7%(+4.07)#69 | 6.2%(+3.53)#4,143 |
| 3. | 30307 | 8.3% | 5.7%(+2.58)#112 | 6.2%(+2.04)#6,811 |
| 4. | 30308 | 7.6% | 5.7%(+1.92)#152 | 6.2%(+1.38)#8,449 |
| 5. | 30338 | 7.4% | 5.7%(+1.65)#168 | 6.2%(+1.11)#9,243 |
| 6. | 30319 | 7.4% | 5.7%(+1.65)#169 | 6.2%(+1.11)#9,254 |
| 7. | 30324 | 7.1% | 5.7%(+1.41)#188 | 6.2%(+0.868)#9,990 |
| 8. | 30350 | 7.0% | 5.7%(+1.31)#192 | 6.2%(+0.771)#10,313 |
| 9. | 30316 | 6.8% | 5.7%(+1.11)#207 | 6.2%(+0.575)#10,939 |
| 10. | 30309 | 6.8% | 5.7%(+1.09)#211 | 6.2%(+0.554)#11,002 |
| 11. | 30341 | 6.6% | 5.7%(+0.937)#221 | 6.2%(+0.397)#11,516 |
| 12. | 30327 | 6.6% | 5.7%(+0.894)#227 | 6.2%(+0.355)#11,667 |
| 13. | 30342 | 6.6% | 5.7%(+0.890)#228 | 6.2%(+0.351)#11,683 |
| 14. | 30312 | 6.5% | 5.7%(+0.838)#233 | 6.2%(+0.299)#11,874 |
| 15. | 30345 | 6.5% | 5.7%(+0.797)#237 | 6.2%(+0.258)#12,021 |
| 16. | 30305 | 5.8% | 5.7%(+0.066)#301 | 6.2%(-0.473)#14,712 |
| 17. | 30331 | 5.6% | 5.7%(-0.143)#320 | 6.2%(-0.682)#15,532 |
| 18. | 30313 | 5.5% | 5.7%(-0.180)#325 | 6.2%(-0.719)#15,694 |
| 19. | 30363 | 5.5% | 5.7%(-0.240)#331 | 6.2%(-0.779)#15,913 |
| 20. | 30328 | 5.4% | 5.7%(-0.280)#336 | 6.2%(-0.819)#16,067 |
| 21. | 30326 | 5.2% | 5.7%(-0.460)#348 | 6.2%(-0.999)#16,769 |
| 22. | 30310 | 5.2% | 5.7%(-0.544)#357 | 6.2%(-1.08)#17,070 |
| 23. | 30329 | 5.0% | 5.7%(-0.746)#379 | 6.2%(-1.28)#17,874 |
| 24. | 30339 | 4.7% | 5.7%(-0.961)#402 | 6.2%(-1.50)#18,698 |
| 25. | 30317 | 4.5% | 5.7%(-1.18)#423 | 6.2%(-1.72)#19,547 |
| 26. | 30349 | 4.1% | 5.7%(-1.59)#458 | 6.2%(-2.13)#20,997 |
| 27. | 30354 | 4.0% | 5.7%(-1.70)#470 | 6.2%(-2.24)#21,344 |
| 28. | 30337 | 3.8% | 5.7%(-1.87)#492 | 6.2%(-2.41)#21,892 |
| 29. | 30318 | 3.7% | 5.7%(-2.00)#501 | 6.2%(-2.54)#22,272 |
| 30. | 30340 | 3.7% | 5.7%(-2.01)#503 | 6.2%(-2.55)#22,301 |
| 31. | 30344 | 3.4% | 5.7%(-2.33)#529 | 6.2%(-2.87)#23,243 |
| 32. | 30315 | 3.2% | 5.7%(-2.54)#543 | 6.2%(-3.08)#23,883 |
| 33. | 30311 | 2.9% | 5.7%(-2.80)#560 | 6.2%(-3.34)#24,562 |
| 34. | 30314 | 2.5% | 5.7%(-3.20)#584 | 6.2%(-3.74)#25,498 |
| 35. | 30360 | 2.3% | 5.7%(-3.44)#597 | 6.2%(-3.98)#25,986 |
| 36. | 30303 | 1.5% | 5.7%(-4.17)#626 | 6.2%(-4.71)#27,171 |
| 37. | 30346 | 1.4% | 5.7%(-4.31)#630 | 6.2%(-4.85)#27,337 |
1
Common Questions
What are the Top 10 Zip Codes with the Highest Percentage of Population Employed in Health Diagnosing & Treating in Atlanta, GA?
Top 10 Zip Codes with the Highest Percentage of Population Employed in Health Diagnosing & Treating in Atlanta, GA are:
What zip code has the Highest Percentage of Population Employed in Health Diagnosing & Treating in Atlanta, GA?
30336 has the Highest Percentage of Population Employed in Health Diagnosing & Treating in Atlanta, GA with 17.1%.
What is the Percentage of Population Employed in Health Diagnosing & Treating in Atlanta, GA?
Percentage of Population Employed in Health Diagnosing & Treating in Atlanta is 5.4%.
What is the Percentage of Population Employed in Health Diagnosing & Treating in Georgia?
Percentage of Population Employed in Health Diagnosing & Treating in Georgia is 5.7%.
What is the Percentage of Population Employed in Health Diagnosing & Treating in the United States?
Percentage of Population Employed in Health Diagnosing & Treating in the United States is 6.2%.