Zip Codes with the Highest Percentage of Population with a Degree in Liberal Arts and History in Atlanta, GA
RELATED REPORTS & OPTIONS
Liberal Arts and History
Atlanta
Compare Zip Codes
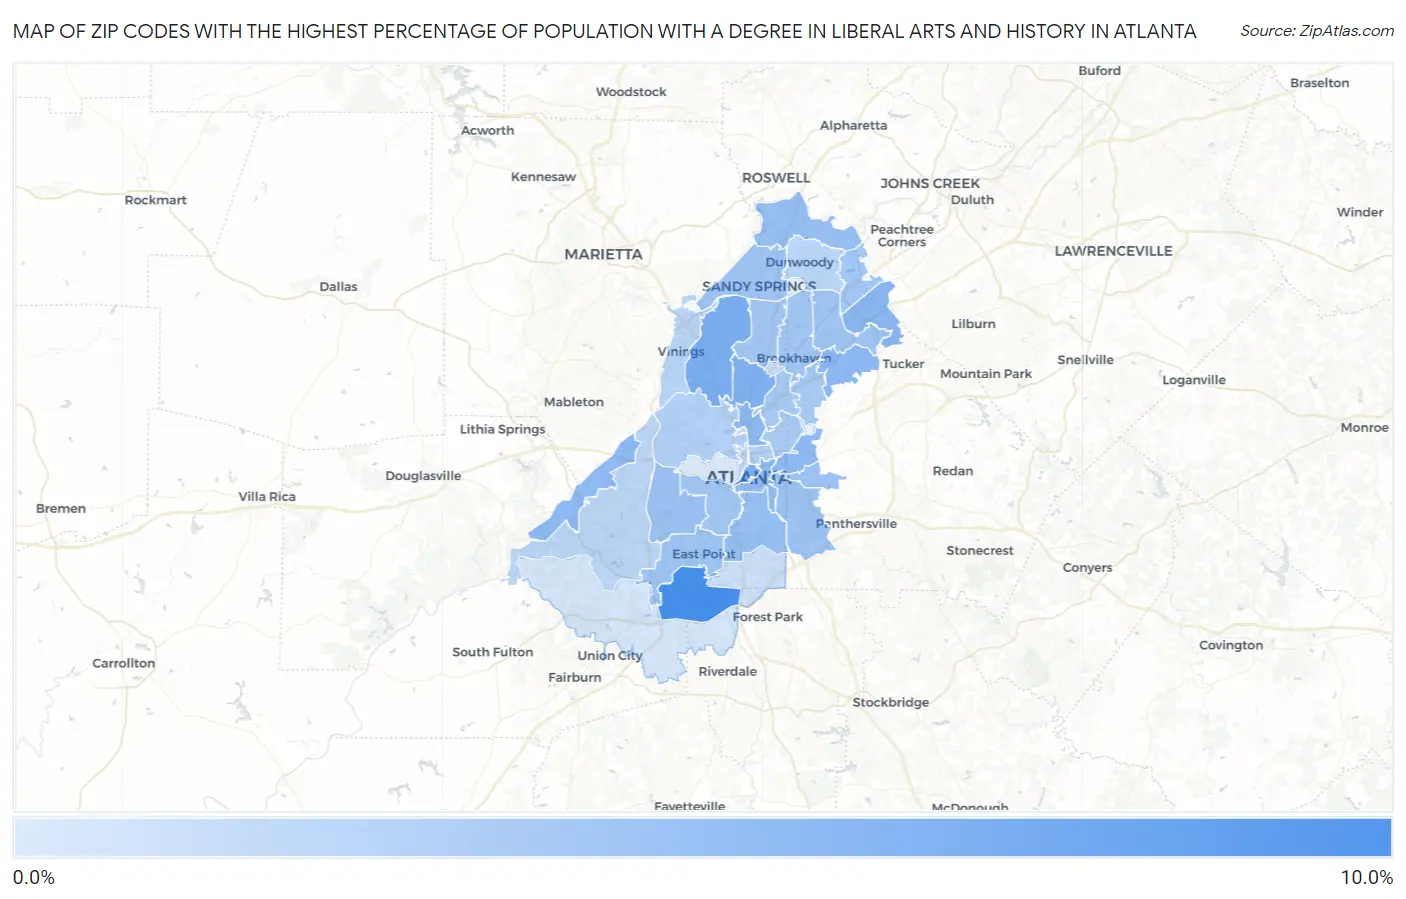
Map of Zip Codes with the Highest Percentage of Population with a Degree in Liberal Arts and History in Atlanta
0.67%
10.0%
Zip Codes with the Highest Percentage of Population with a Degree in Liberal Arts and History in Atlanta, GA
| Zip Code | % Graduates | vs State | vs National | |
| 1. | 30337 | 10.0% | 4.1%(+5.84)#57 | 4.9%(+5.09)#3,136 |
| 2. | 30303 | 6.8% | 4.1%(+2.64)#130 | 4.9%(+1.89)#6,799 |
| 3. | 30327 | 6.6% | 4.1%(+2.46)#136 | 4.9%(+1.71)#7,187 |
| 4. | 30305 | 6.3% | 4.1%(+2.21)#148 | 4.9%(+1.46)#7,695 |
| 5. | 30340 | 5.8% | 4.1%(+1.66)#175 | 4.9%(+0.908)#9,095 |
| 6. | 30345 | 5.6% | 4.1%(+1.48)#179 | 4.9%(+0.730)#9,563 |
| 7. | 30307 | 5.5% | 4.1%(+1.33)#190 | 4.9%(+0.584)#9,983 |
| 8. | 30309 | 5.4% | 4.1%(+1.27)#193 | 4.9%(+0.525)#10,140 |
| 9. | 30336 | 5.4% | 4.1%(+1.27)#194 | 4.9%(+0.522)#10,149 |
| 10. | 30312 | 5.3% | 4.1%(+1.15)#202 | 4.9%(+0.405)#10,509 |
| 11. | 30315 | 4.9% | 4.1%(+0.726)#237 | 4.9%(-0.020)#11,812 |
| 12. | 30350 | 4.8% | 4.1%(+0.667)#240 | 4.9%(-0.080)#11,995 |
| 13. | 30311 | 4.6% | 4.1%(+0.451)#258 | 4.9%(-0.295)#12,711 |
| 14. | 30317 | 4.5% | 4.1%(+0.397)#266 | 4.9%(-0.349)#12,905 |
| 15. | 30344 | 4.5% | 4.1%(+0.356)#269 | 4.9%(-0.390)#13,022 |
| 16. | 30316 | 4.5% | 4.1%(+0.324)#270 | 4.9%(-0.422)#13,123 |
| 17. | 30341 | 4.3% | 4.1%(+0.177)#279 | 4.9%(-0.569)#13,626 |
| 18. | 30328 | 4.3% | 4.1%(+0.143)#282 | 4.9%(-0.604)#13,746 |
| 19. | 30342 | 4.2% | 4.1%(+0.044)#299 | 4.9%(-0.703)#14,135 |
| 20. | 30319 | 4.1% | 4.1%(+0.014)#303 | 4.9%(-0.733)#14,243 |
| 21. | 30360 | 4.1% | 4.1%(-0.013)#305 | 4.9%(-0.759)#14,354 |
| 22. | 30310 | 4.1% | 4.1%(-0.021)#307 | 4.9%(-0.768)#14,386 |
| 23. | 30329 | 3.8% | 4.1%(-0.296)#335 | 4.9%(-1.04)#15,417 |
| 24. | 30324 | 3.8% | 4.1%(-0.314)#338 | 4.9%(-1.06)#15,478 |
| 25. | 30306 | 3.8% | 4.1%(-0.347)#344 | 4.9%(-1.09)#15,601 |
| 26. | 30308 | 3.2% | 4.1%(-0.896)#396 | 4.9%(-1.64)#17,553 |
| 27. | 30313 | 3.2% | 4.1%(-0.906)#398 | 4.9%(-1.65)#17,583 |
| 28. | 30318 | 3.1% | 4.1%(-0.982)#406 | 4.9%(-1.73)#17,850 |
| 29. | 30338 | 2.8% | 4.1%(-1.36)#432 | 4.9%(-2.11)#19,111 |
| 30. | 30339 | 2.7% | 4.1%(-1.38)#435 | 4.9%(-2.12)#19,158 |
| 31. | 30331 | 2.7% | 4.1%(-1.45)#442 | 4.9%(-2.20)#19,423 |
| 32. | 30363 | 2.4% | 4.1%(-1.74)#460 | 4.9%(-2.48)#20,302 |
| 33. | 30326 | 1.6% | 4.1%(-2.48)#509 | 4.9%(-3.23)#22,196 |
| 34. | 30354 | 1.6% | 4.1%(-2.51)#513 | 4.9%(-3.26)#22,263 |
| 35. | 30349 | 1.1% | 4.1%(-2.99)#531 | 4.9%(-3.74)#23,154 |
| 36. | 30314 | 0.67% | 4.1%(-3.45)#555 | 4.9%(-4.20)#23,852 |
1
Common Questions
What are the Top 10 Zip Codes with the Highest Percentage of Population with a Degree in Liberal Arts and History in Atlanta, GA?
Top 10 Zip Codes with the Highest Percentage of Population with a Degree in Liberal Arts and History in Atlanta, GA are:
What zip code has the Highest Percentage of Population with a Degree in Liberal Arts and History in Atlanta, GA?
30337 has the Highest Percentage of Population with a Degree in Liberal Arts and History in Atlanta, GA with 10.0%.
What is the Percentage of Population with a Degree in Liberal Arts and History in Atlanta, GA?
Percentage of Population with a Degree in Liberal Arts and History in Atlanta is 4.5%.
What is the Percentage of Population with a Degree in Liberal Arts and History in Georgia?
Percentage of Population with a Degree in Liberal Arts and History in Georgia is 4.1%.
What is the Percentage of Population with a Degree in Liberal Arts and History in the United States?
Percentage of Population with a Degree in Liberal Arts and History in the United States is 4.9%.