Immigrants from Ecuador vs Alaskan Athabascan Married-couple Households
COMPARE
Immigrants from Ecuador
Alaskan Athabascan
Married-couple Households
Married-couple Households Comparison
Immigrants from Ecuador
Alaskan Athabascans
42.9%
MARRIED-COUPLE HOUSEHOLDS
0.0/ 100
METRIC RATING
280th/ 347
METRIC RANK
43.6%
MARRIED-COUPLE HOUSEHOLDS
0.2/ 100
METRIC RATING
261st/ 347
METRIC RANK
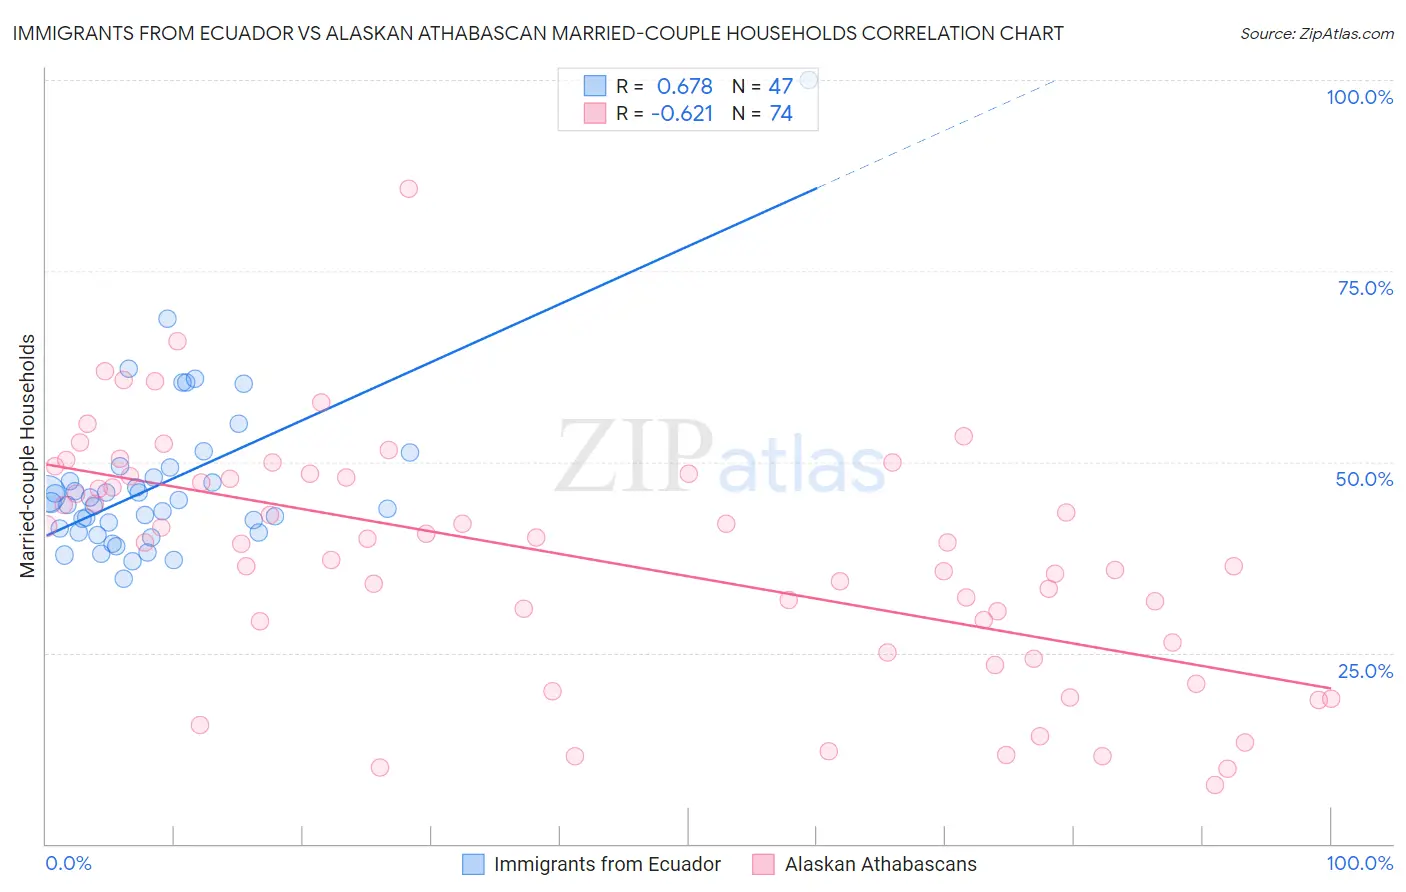
Immigrants from Ecuador vs Alaskan Athabascan Married-couple Households Correlation Chart
The statistical analysis conducted on geographies consisting of 270,883,052 people shows a significant positive correlation between the proportion of Immigrants from Ecuador and percentage of married-couple family households in the United States with a correlation coefficient (R) of 0.678 and weighted average of 42.9%. Similarly, the statistical analysis conducted on geographies consisting of 45,814,810 people shows a significant negative correlation between the proportion of Alaskan Athabascans and percentage of married-couple family households in the United States with a correlation coefficient (R) of -0.621 and weighted average of 43.6%, a difference of 1.8%.
Married-couple Households Correlation Summary
| Measurement | Immigrants from Ecuador | Alaskan Athabascan |
| Minimum | 34.8% | 7.7% |
| Maximum | 100.0% | 85.7% |
| Range | 65.2% | 78.0% |
| Mean | 47.2% | 37.3% |
| Median | 44.7% | 39.4% |
| Interquartile 25% (IQ1) | 40.8% | 26.4% |
| Interquartile 75% (IQ3) | 49.2% | 48.1% |
| Interquartile Range (IQR) | 8.5% | 21.7% |
| Standard Deviation (Sample) | 10.9% | 15.6% |
| Standard Deviation (Population) | 10.8% | 15.5% |
Demographics Similar to Immigrants from Ecuador and Alaskan Athabascans by Married-couple Households
In terms of married-couple households, the demographic groups most similar to Immigrants from Ecuador are Sierra Leonean (42.9%, a difference of 0.050%), Immigrants from Africa (42.9%, a difference of 0.080%), Immigrants from Eastern Africa (42.9%, a difference of 0.19%), Immigrants from Ethiopia (43.1%, a difference of 0.45%), and Immigrants from Bangladesh (43.1%, a difference of 0.56%). Similarly, the demographic groups most similar to Alaskan Athabascans are Vietnamese (43.6%, a difference of 0.060%), Immigrants from Cameroon (43.7%, a difference of 0.13%), Cree (43.6%, a difference of 0.17%), Bangladeshi (43.5%, a difference of 0.28%), and Moroccan (43.5%, a difference of 0.36%).
| Demographics | Rating | Rank | Married-couple Households |
| Immigrants | Cameroon | 0.2 /100 | #260 | Tragic 43.7% |
| Alaskan Athabascans | 0.2 /100 | #261 | Tragic 43.6% |
| Vietnamese | 0.2 /100 | #262 | Tragic 43.6% |
| Cree | 0.1 /100 | #263 | Tragic 43.6% |
| Bangladeshis | 0.1 /100 | #264 | Tragic 43.5% |
| Moroccans | 0.1 /100 | #265 | Tragic 43.5% |
| Ecuadorians | 0.1 /100 | #266 | Tragic 43.5% |
| Natives/Alaskans | 0.1 /100 | #267 | Tragic 43.5% |
| Immigrants | Burma/Myanmar | 0.1 /100 | #268 | Tragic 43.4% |
| Immigrants | Sierra Leone | 0.1 /100 | #269 | Tragic 43.3% |
| Yuman | 0.1 /100 | #270 | Tragic 43.3% |
| Guatemalans | 0.1 /100 | #271 | Tragic 43.3% |
| Immigrants | Nigeria | 0.1 /100 | #272 | Tragic 43.2% |
| Ethiopians | 0.1 /100 | #273 | Tragic 43.2% |
| Nigerians | 0.1 /100 | #274 | Tragic 43.2% |
| Immigrants | Bangladesh | 0.0 /100 | #275 | Tragic 43.1% |
| Immigrants | Ethiopia | 0.0 /100 | #276 | Tragic 43.1% |
| Immigrants | Eastern Africa | 0.0 /100 | #277 | Tragic 42.9% |
| Immigrants | Africa | 0.0 /100 | #278 | Tragic 42.9% |
| Sierra Leoneans | 0.0 /100 | #279 | Tragic 42.9% |
| Immigrants | Ecuador | 0.0 /100 | #280 | Tragic 42.9% |