Immigrants from Ecuador vs Immigrants from Zaire Married-couple Households
COMPARE
Immigrants from Ecuador
Immigrants from Zaire
Married-couple Households
Married-couple Households Comparison
Immigrants from Ecuador
Immigrants from Zaire
42.9%
MARRIED-COUPLE HOUSEHOLDS
0.0/ 100
METRIC RATING
280th/ 347
METRIC RANK
40.1%
MARRIED-COUPLE HOUSEHOLDS
0.0/ 100
METRIC RATING
322nd/ 347
METRIC RANK
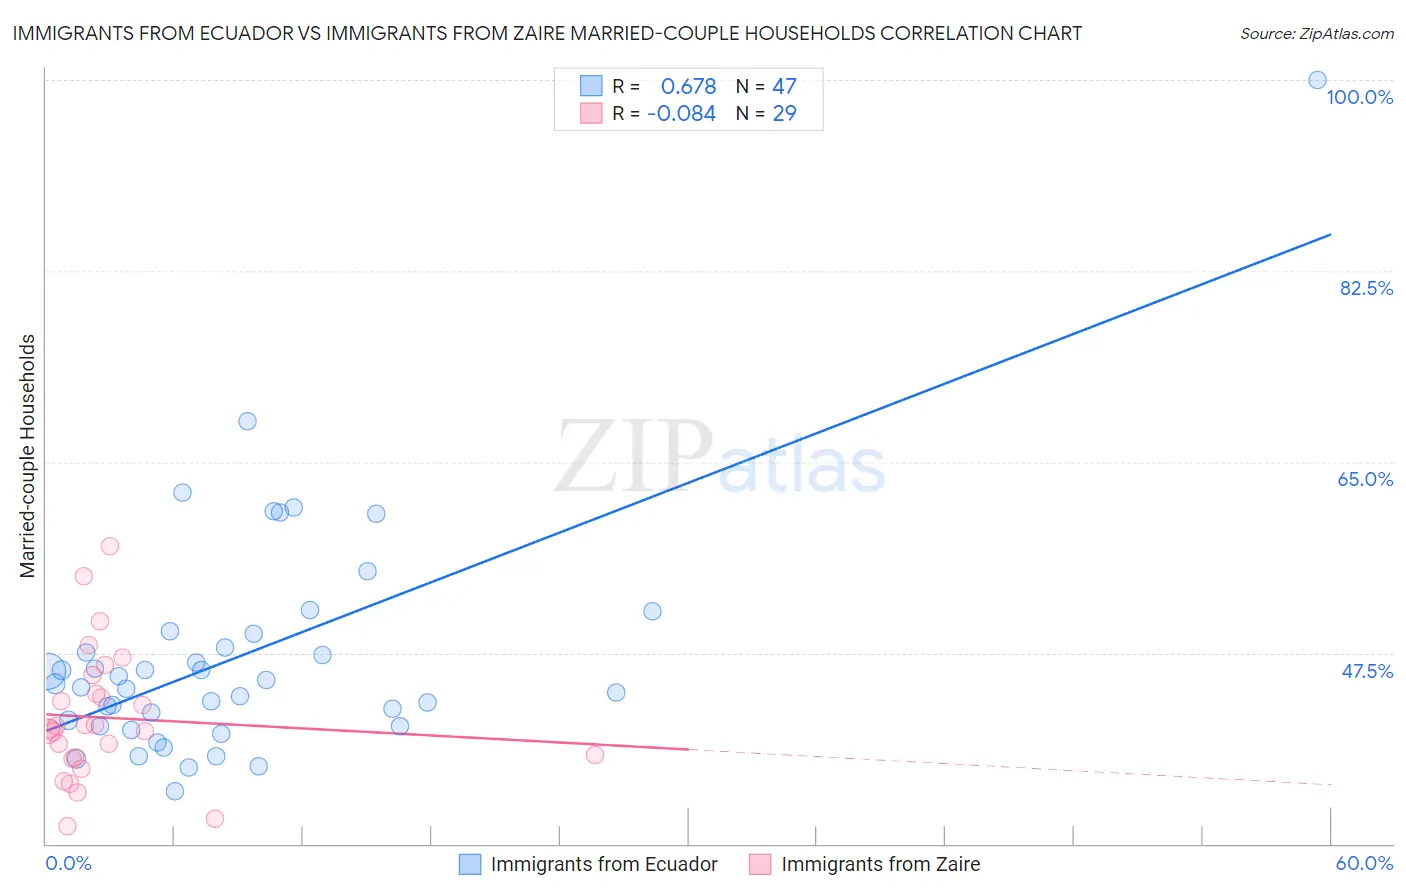
Immigrants from Ecuador vs Immigrants from Zaire Married-couple Households Correlation Chart
The statistical analysis conducted on geographies consisting of 270,883,052 people shows a significant positive correlation between the proportion of Immigrants from Ecuador and percentage of married-couple family households in the United States with a correlation coefficient (R) of 0.678 and weighted average of 42.9%. Similarly, the statistical analysis conducted on geographies consisting of 107,245,713 people shows a slight negative correlation between the proportion of Immigrants from Zaire and percentage of married-couple family households in the United States with a correlation coefficient (R) of -0.084 and weighted average of 40.1%, a difference of 7.0%.
Married-couple Households Correlation Summary
| Measurement | Immigrants from Ecuador | Immigrants from Zaire |
| Minimum | 34.8% | 31.6% |
| Maximum | 100.0% | 57.2% |
| Range | 65.2% | 25.6% |
| Mean | 47.2% | 41.6% |
| Median | 44.7% | 40.6% |
| Interquartile 25% (IQ1) | 40.8% | 37.8% |
| Interquartile 75% (IQ3) | 49.2% | 44.6% |
| Interquartile Range (IQR) | 8.5% | 6.8% |
| Standard Deviation (Sample) | 10.9% | 6.0% |
| Standard Deviation (Population) | 10.8% | 5.9% |
Similar Demographics by Married-couple Households
Demographics Similar to Immigrants from Ecuador by Married-couple Households
In terms of married-couple households, the demographic groups most similar to Immigrants from Ecuador are Sierra Leonean (42.9%, a difference of 0.050%), Immigrants from Guatemala (42.8%, a difference of 0.070%), Immigrants from Africa (42.9%, a difference of 0.080%), Immigrants from Eastern Africa (42.9%, a difference of 0.19%), and Immigrants from Ethiopia (43.1%, a difference of 0.45%).
| Demographics | Rating | Rank | Married-couple Households |
| Ethiopians | 0.1 /100 | #273 | Tragic 43.2% |
| Nigerians | 0.1 /100 | #274 | Tragic 43.2% |
| Immigrants | Bangladesh | 0.0 /100 | #275 | Tragic 43.1% |
| Immigrants | Ethiopia | 0.0 /100 | #276 | Tragic 43.1% |
| Immigrants | Eastern Africa | 0.0 /100 | #277 | Tragic 42.9% |
| Immigrants | Africa | 0.0 /100 | #278 | Tragic 42.9% |
| Sierra Leoneans | 0.0 /100 | #279 | Tragic 42.9% |
| Immigrants | Ecuador | 0.0 /100 | #280 | Tragic 42.9% |
| Immigrants | Guatemala | 0.0 /100 | #281 | Tragic 42.8% |
| Bermudans | 0.0 /100 | #282 | Tragic 42.4% |
| Inupiat | 0.0 /100 | #283 | Tragic 42.4% |
| Cheyenne | 0.0 /100 | #284 | Tragic 42.3% |
| Ghanaians | 0.0 /100 | #285 | Tragic 42.2% |
| Belizeans | 0.0 /100 | #286 | Tragic 42.2% |
| Chippewa | 0.0 /100 | #287 | Tragic 42.1% |
Demographics Similar to Immigrants from Zaire by Married-couple Households
In terms of married-couple households, the demographic groups most similar to Immigrants from Zaire are Puerto Rican (40.1%, a difference of 0.0%), Navajo (40.1%, a difference of 0.010%), Pueblo (40.0%, a difference of 0.24%), Immigrants from Liberia (40.3%, a difference of 0.66%), and West Indian (40.3%, a difference of 0.70%).
| Demographics | Rating | Rank | Married-couple Households |
| Trinidadians and Tobagonians | 0.0 /100 | #315 | Tragic 40.9% |
| Immigrants | Caribbean | 0.0 /100 | #316 | Tragic 40.8% |
| Immigrants | Jamaica | 0.0 /100 | #317 | Tragic 40.7% |
| Liberians | 0.0 /100 | #318 | Tragic 40.7% |
| Bahamians | 0.0 /100 | #319 | Tragic 40.5% |
| West Indians | 0.0 /100 | #320 | Tragic 40.3% |
| Immigrants | Liberia | 0.0 /100 | #321 | Tragic 40.3% |
| Immigrants | Zaire | 0.0 /100 | #322 | Tragic 40.1% |
| Puerto Ricans | 0.0 /100 | #323 | Tragic 40.1% |
| Navajo | 0.0 /100 | #324 | Tragic 40.1% |
| Pueblo | 0.0 /100 | #325 | Tragic 40.0% |
| U.S. Virgin Islanders | 0.0 /100 | #326 | Tragic 39.8% |
| Lumbee | 0.0 /100 | #327 | Tragic 39.6% |
| Barbadians | 0.0 /100 | #328 | Tragic 39.4% |
| Immigrants | Dominica | 0.0 /100 | #329 | Tragic 39.4% |