Immigrants from the Azores vs Cambodian Married-couple Households
COMPARE
Immigrants from the Azores
Cambodian
Married-couple Households
Married-couple Households Comparison
Immigrants from the Azores
Cambodians
45.2%
MARRIED-COUPLE HOUSEHOLDS
5.3/ 100
METRIC RATING
218th/ 347
METRIC RANK
45.9%
MARRIED-COUPLE HOUSEHOLDS
21.3/ 100
METRIC RATING
197th/ 347
METRIC RANK
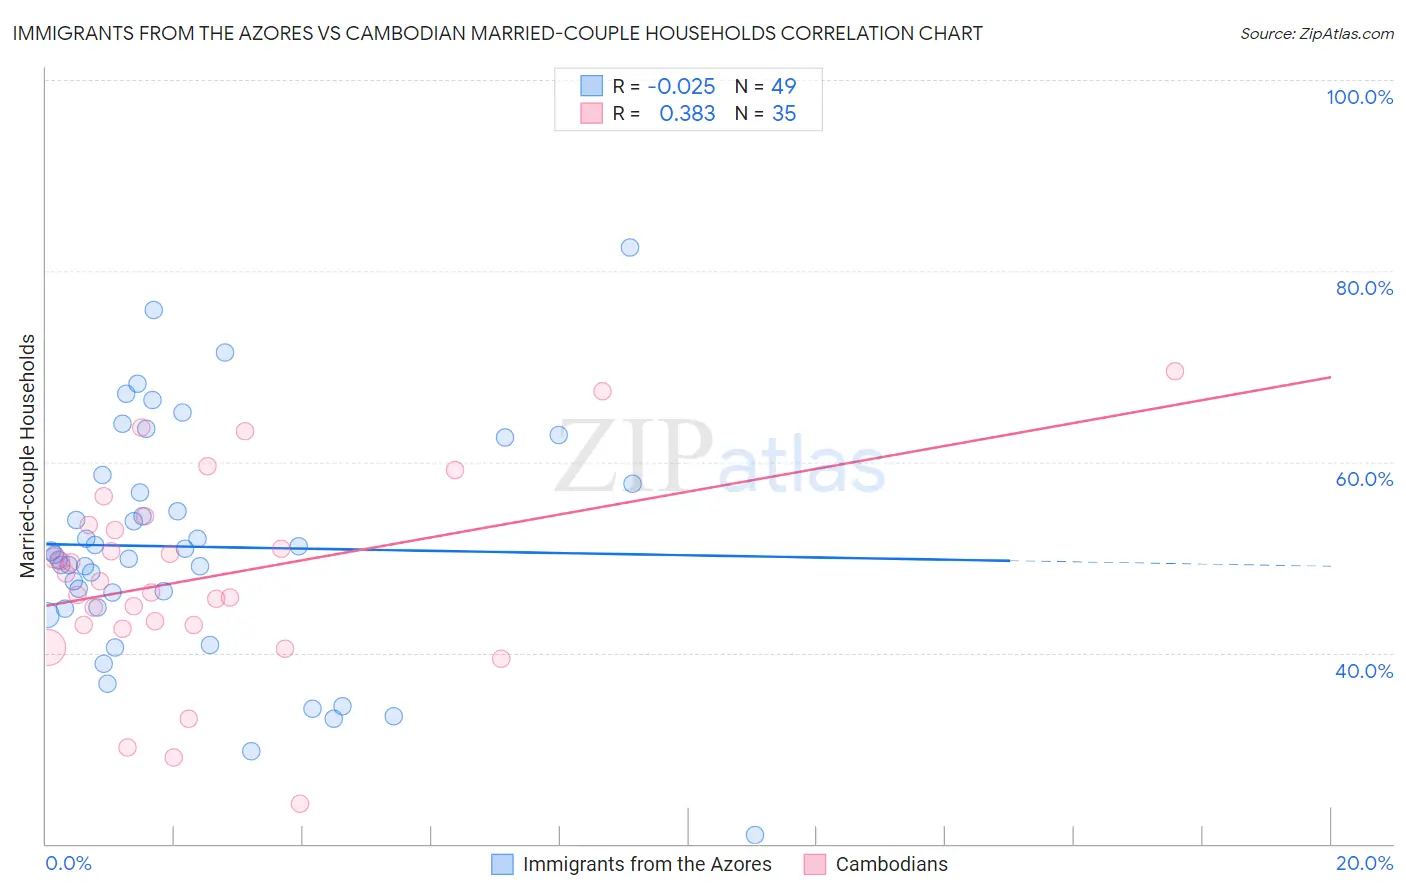
Immigrants from the Azores vs Cambodian Married-couple Households Correlation Chart
The statistical analysis conducted on geographies consisting of 46,257,310 people shows no correlation between the proportion of Immigrants from the Azores and percentage of married-couple family households in the United States with a correlation coefficient (R) of -0.025 and weighted average of 45.2%. Similarly, the statistical analysis conducted on geographies consisting of 102,469,130 people shows a mild positive correlation between the proportion of Cambodians and percentage of married-couple family households in the United States with a correlation coefficient (R) of 0.383 and weighted average of 45.9%, a difference of 1.5%.
Married-couple Households Correlation Summary
| Measurement | Immigrants from the Azores | Cambodian |
| Minimum | 21.0% | 24.1% |
| Maximum | 82.5% | 69.5% |
| Range | 61.5% | 45.4% |
| Mean | 51.1% | 47.9% |
| Median | 50.2% | 47.5% |
| Interquartile 25% (IQ1) | 44.7% | 42.9% |
| Interquartile 75% (IQ3) | 58.1% | 53.4% |
| Interquartile Range (IQR) | 13.4% | 10.5% |
| Standard Deviation (Sample) | 12.2% | 10.2% |
| Standard Deviation (Population) | 12.1% | 10.1% |
Similar Demographics by Married-couple Households
Demographics Similar to Immigrants from the Azores by Married-couple Households
In terms of married-couple households, the demographic groups most similar to Immigrants from the Azores are Nicaraguan (45.2%, a difference of 0.010%), Panamanian (45.2%, a difference of 0.030%), Immigrants from Thailand (45.2%, a difference of 0.040%), Immigrants from Nepal (45.2%, a difference of 0.050%), and Immigrants from Portugal (45.2%, a difference of 0.050%).
| Demographics | Rating | Rank | Married-couple Households |
| Immigrants | Spain | 7.3 /100 | #211 | Tragic 45.3% |
| Creek | 6.4 /100 | #212 | Tragic 45.3% |
| Yakama | 5.8 /100 | #213 | Tragic 45.2% |
| Japanese | 5.7 /100 | #214 | Tragic 45.2% |
| Immigrants | Nepal | 5.6 /100 | #215 | Tragic 45.2% |
| Immigrants | Portugal | 5.6 /100 | #216 | Tragic 45.2% |
| Panamanians | 5.5 /100 | #217 | Tragic 45.2% |
| Immigrants | Azores | 5.3 /100 | #218 | Tragic 45.2% |
| Nicaraguans | 5.3 /100 | #219 | Tragic 45.2% |
| Immigrants | Thailand | 5.1 /100 | #220 | Tragic 45.2% |
| Tlingit-Haida | 4.9 /100 | #221 | Tragic 45.1% |
| Immigrants | Laos | 4.6 /100 | #222 | Tragic 45.1% |
| Immigrants | Cambodia | 2.7 /100 | #223 | Tragic 44.9% |
| Immigrants | Micronesia | 2.6 /100 | #224 | Tragic 44.9% |
| Dutch West Indians | 2.6 /100 | #225 | Tragic 44.9% |
Demographics Similar to Cambodians by Married-couple Households
In terms of married-couple households, the demographic groups most similar to Cambodians are Immigrants from South America (45.9%, a difference of 0.050%), Chickasaw (45.9%, a difference of 0.080%), Mexican American Indian (45.9%, a difference of 0.11%), Ottawa (45.8%, a difference of 0.11%), and Taiwanese (45.9%, a difference of 0.12%).
| Demographics | Rating | Rank | Married-couple Households |
| Immigrants | Kuwait | 25.6 /100 | #190 | Fair 46.0% |
| Choctaw | 24.9 /100 | #191 | Fair 46.0% |
| Immigrants | Northern Africa | 24.6 /100 | #192 | Fair 46.0% |
| Taiwanese | 23.4 /100 | #193 | Fair 45.9% |
| Mexican American Indians | 23.3 /100 | #194 | Fair 45.9% |
| Chickasaw | 22.7 /100 | #195 | Fair 45.9% |
| Immigrants | South America | 22.2 /100 | #196 | Fair 45.9% |
| Cambodians | 21.3 /100 | #197 | Fair 45.9% |
| Ottawa | 19.4 /100 | #198 | Poor 45.8% |
| Carpatho Rusyns | 15.7 /100 | #199 | Poor 45.7% |
| Potawatomi | 15.6 /100 | #200 | Poor 45.7% |
| Immigrants | Serbia | 15.2 /100 | #201 | Poor 45.7% |
| Immigrants | Central America | 14.2 /100 | #202 | Poor 45.7% |
| Alaska Natives | 13.0 /100 | #203 | Poor 45.6% |
| Aleuts | 12.5 /100 | #204 | Poor 45.6% |