Immigrants from the Azores vs Spaniard Married-couple Households
COMPARE
Immigrants from the Azores
Spaniard
Married-couple Households
Married-couple Households Comparison
Immigrants from the Azores
Spaniards
45.2%
MARRIED-COUPLE HOUSEHOLDS
5.3/ 100
METRIC RATING
218th/ 347
METRIC RANK
47.2%
MARRIED-COUPLE HOUSEHOLDS
84.1/ 100
METRIC RATING
142nd/ 347
METRIC RANK
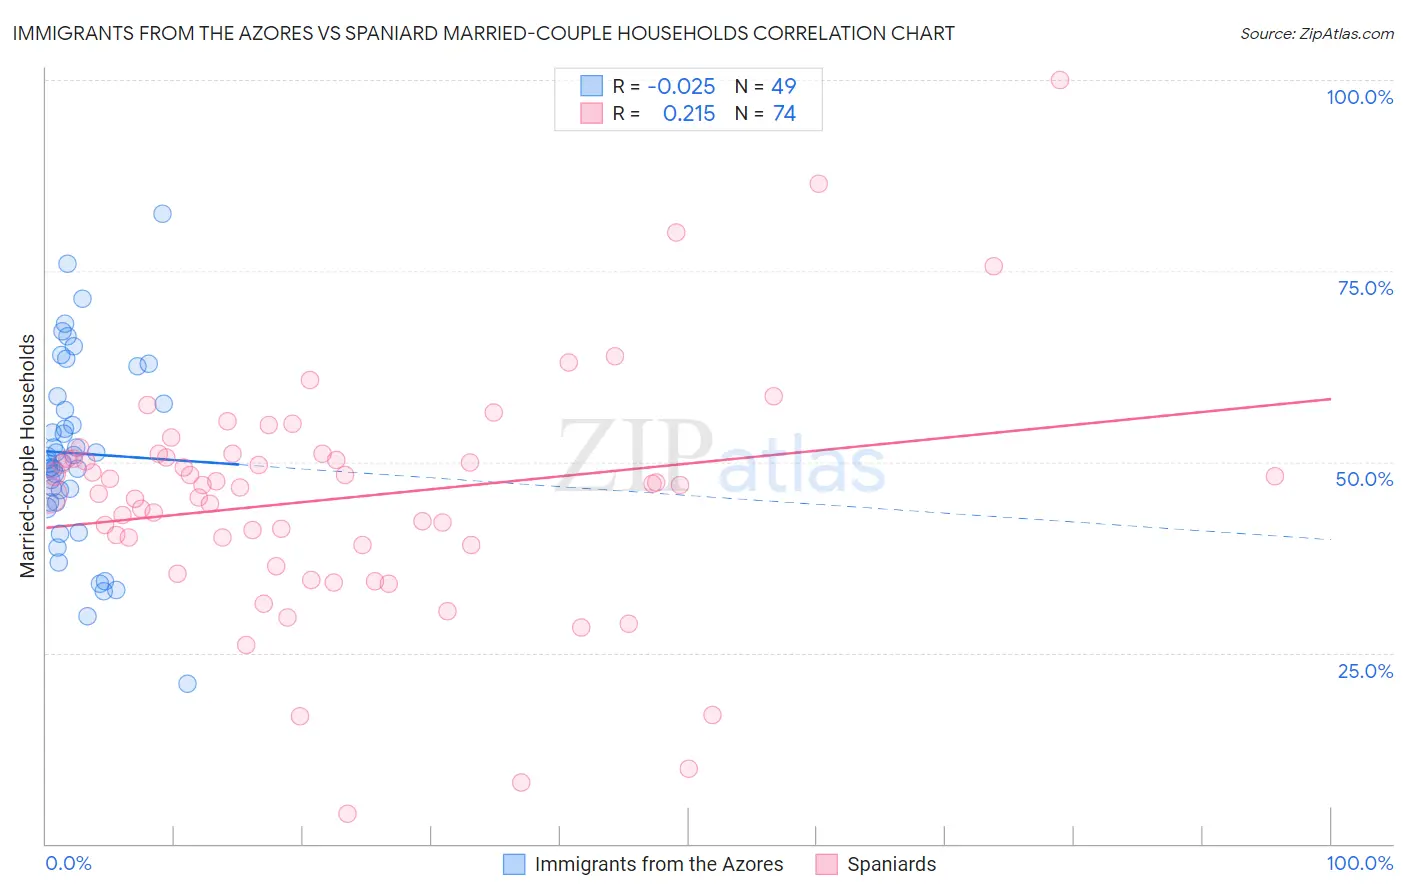
Immigrants from the Azores vs Spaniard Married-couple Households Correlation Chart
The statistical analysis conducted on geographies consisting of 46,257,310 people shows no correlation between the proportion of Immigrants from the Azores and percentage of married-couple family households in the United States with a correlation coefficient (R) of -0.025 and weighted average of 45.2%. Similarly, the statistical analysis conducted on geographies consisting of 443,146,700 people shows a weak positive correlation between the proportion of Spaniards and percentage of married-couple family households in the United States with a correlation coefficient (R) of 0.215 and weighted average of 47.2%, a difference of 4.4%.
Married-couple Households Correlation Summary
| Measurement | Immigrants from the Azores | Spaniard |
| Minimum | 21.0% | 4.0% |
| Maximum | 82.5% | 100.0% |
| Range | 61.5% | 96.0% |
| Mean | 51.1% | 45.3% |
| Median | 50.2% | 47.0% |
| Interquartile 25% (IQ1) | 44.7% | 39.1% |
| Interquartile 75% (IQ3) | 58.1% | 50.6% |
| Interquartile Range (IQR) | 13.4% | 11.4% |
| Standard Deviation (Sample) | 12.2% | 15.4% |
| Standard Deviation (Population) | 12.1% | 15.3% |
Similar Demographics by Married-couple Households
Demographics Similar to Immigrants from the Azores by Married-couple Households
In terms of married-couple households, the demographic groups most similar to Immigrants from the Azores are Nicaraguan (45.2%, a difference of 0.010%), Panamanian (45.2%, a difference of 0.030%), Immigrants from Thailand (45.2%, a difference of 0.040%), Immigrants from Nepal (45.2%, a difference of 0.050%), and Immigrants from Portugal (45.2%, a difference of 0.050%).
| Demographics | Rating | Rank | Married-couple Households |
| Immigrants | Spain | 7.3 /100 | #211 | Tragic 45.3% |
| Creek | 6.4 /100 | #212 | Tragic 45.3% |
| Yakama | 5.8 /100 | #213 | Tragic 45.2% |
| Japanese | 5.7 /100 | #214 | Tragic 45.2% |
| Immigrants | Nepal | 5.6 /100 | #215 | Tragic 45.2% |
| Immigrants | Portugal | 5.6 /100 | #216 | Tragic 45.2% |
| Panamanians | 5.5 /100 | #217 | Tragic 45.2% |
| Immigrants | Azores | 5.3 /100 | #218 | Tragic 45.2% |
| Nicaraguans | 5.3 /100 | #219 | Tragic 45.2% |
| Immigrants | Thailand | 5.1 /100 | #220 | Tragic 45.2% |
| Tlingit-Haida | 4.9 /100 | #221 | Tragic 45.1% |
| Immigrants | Laos | 4.6 /100 | #222 | Tragic 45.1% |
| Immigrants | Cambodia | 2.7 /100 | #223 | Tragic 44.9% |
| Immigrants | Micronesia | 2.6 /100 | #224 | Tragic 44.9% |
| Dutch West Indians | 2.6 /100 | #225 | Tragic 44.9% |
Demographics Similar to Spaniards by Married-couple Households
In terms of married-couple households, the demographic groups most similar to Spaniards are Spanish (47.2%, a difference of 0.020%), Costa Rican (47.2%, a difference of 0.020%), Immigrants from Belarus (47.2%, a difference of 0.020%), Immigrants from Sweden (47.2%, a difference of 0.040%), and Mexican (47.1%, a difference of 0.050%).
| Demographics | Rating | Rank | Married-couple Households |
| Immigrants | Argentina | 86.0 /100 | #135 | Excellent 47.2% |
| New Zealanders | 85.3 /100 | #136 | Excellent 47.2% |
| Immigrants | Malaysia | 85.2 /100 | #137 | Excellent 47.2% |
| Immigrants | Afghanistan | 85.1 /100 | #138 | Excellent 47.2% |
| Immigrants | Sweden | 84.7 /100 | #139 | Excellent 47.2% |
| Spanish | 84.5 /100 | #140 | Excellent 47.2% |
| Costa Ricans | 84.4 /100 | #141 | Excellent 47.2% |
| Spaniards | 84.1 /100 | #142 | Excellent 47.2% |
| Immigrants | Belarus | 83.8 /100 | #143 | Excellent 47.2% |
| Mexicans | 83.4 /100 | #144 | Excellent 47.1% |
| Slovenes | 81.7 /100 | #145 | Excellent 47.1% |
| Immigrants | Western Europe | 81.6 /100 | #146 | Excellent 47.1% |
| Immigrants | Syria | 81.6 /100 | #147 | Excellent 47.1% |
| Icelanders | 79.5 /100 | #148 | Good 47.0% |
| Paraguayans | 78.7 /100 | #149 | Good 47.0% |