Immigrants from the Azores vs Comanche Married-couple Households
COMPARE
Immigrants from the Azores
Comanche
Married-couple Households
Married-couple Households Comparison
Immigrants from the Azores
Comanche
45.2%
MARRIED-COUPLE HOUSEHOLDS
5.3/ 100
METRIC RATING
218th/ 347
METRIC RANK
44.5%
MARRIED-COUPLE HOUSEHOLDS
1.2/ 100
METRIC RATING
237th/ 347
METRIC RANK
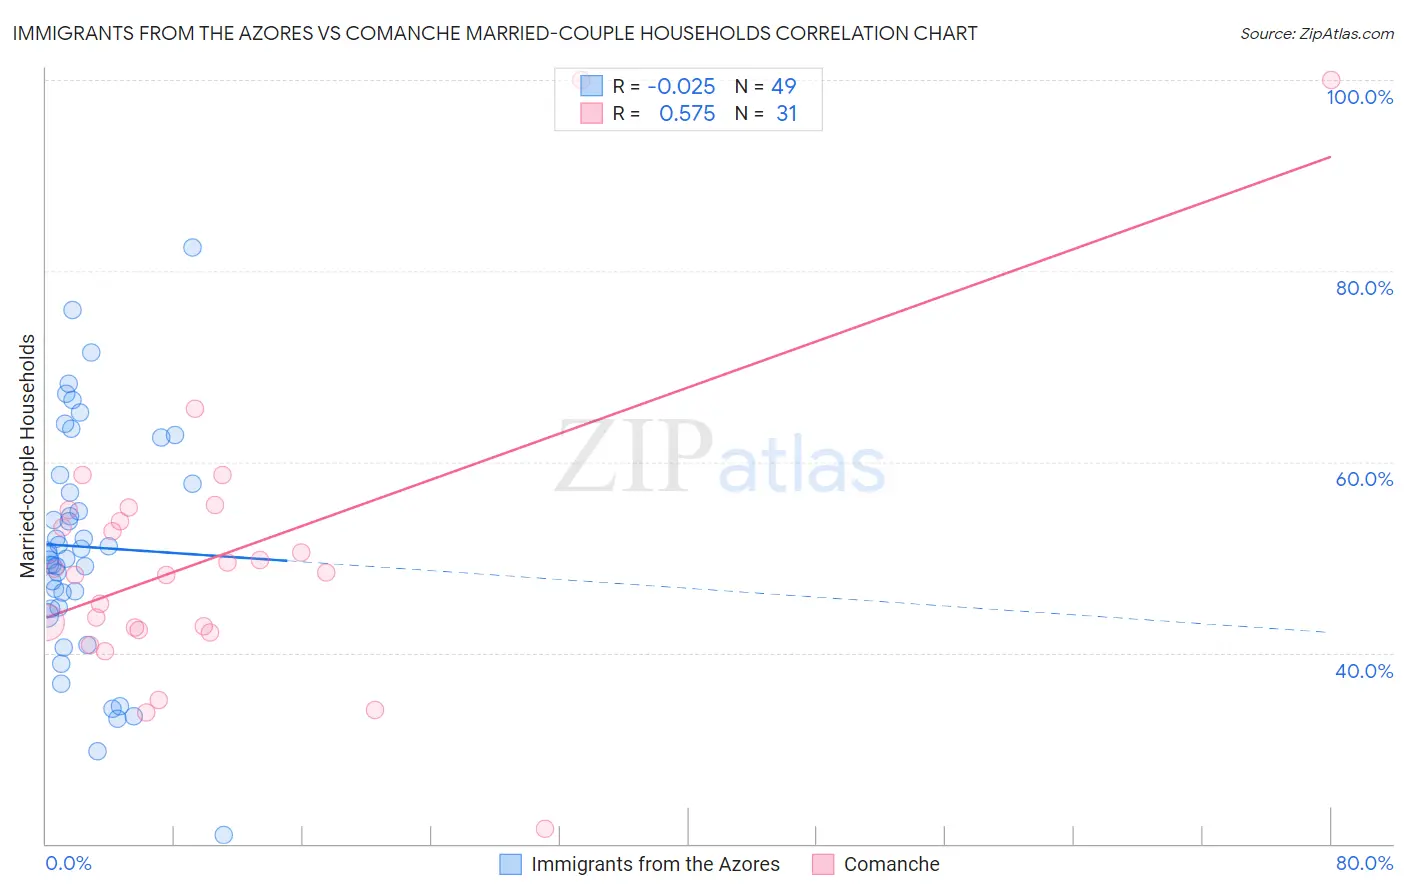
Immigrants from the Azores vs Comanche Married-couple Households Correlation Chart
The statistical analysis conducted on geographies consisting of 46,257,310 people shows no correlation between the proportion of Immigrants from the Azores and percentage of married-couple family households in the United States with a correlation coefficient (R) of -0.025 and weighted average of 45.2%. Similarly, the statistical analysis conducted on geographies consisting of 109,768,112 people shows a substantial positive correlation between the proportion of Comanche and percentage of married-couple family households in the United States with a correlation coefficient (R) of 0.575 and weighted average of 44.5%, a difference of 1.5%.
Married-couple Households Correlation Summary
| Measurement | Immigrants from the Azores | Comanche |
| Minimum | 21.0% | 21.6% |
| Maximum | 82.5% | 100.0% |
| Range | 61.5% | 78.4% |
| Mean | 51.1% | 50.3% |
| Median | 50.2% | 48.4% |
| Interquartile 25% (IQ1) | 44.7% | 42.4% |
| Interquartile 75% (IQ3) | 58.1% | 55.0% |
| Interquartile Range (IQR) | 13.4% | 12.6% |
| Standard Deviation (Sample) | 12.2% | 15.9% |
| Standard Deviation (Population) | 12.1% | 15.6% |
Demographics Similar to Immigrants from the Azores and Comanche by Married-couple Households
In terms of married-couple households, the demographic groups most similar to Immigrants from the Azores are Nicaraguan (45.2%, a difference of 0.010%), Panamanian (45.2%, a difference of 0.030%), Immigrants from Thailand (45.2%, a difference of 0.040%), Tlingit-Haida (45.1%, a difference of 0.090%), and Immigrants from Laos (45.1%, a difference of 0.14%). Similarly, the demographic groups most similar to Comanche are Yaqui (44.5%, a difference of 0.030%), Immigrants from Nicaragua (44.5%, a difference of 0.040%), Immigrants from Panama (44.6%, a difference of 0.11%), Immigrants from Uganda (44.6%, a difference of 0.23%), and Houma (44.6%, a difference of 0.27%).
| Demographics | Rating | Rank | Married-couple Households |
| Panamanians | 5.5 /100 | #217 | Tragic 45.2% |
| Immigrants | Azores | 5.3 /100 | #218 | Tragic 45.2% |
| Nicaraguans | 5.3 /100 | #219 | Tragic 45.2% |
| Immigrants | Thailand | 5.1 /100 | #220 | Tragic 45.2% |
| Tlingit-Haida | 4.9 /100 | #221 | Tragic 45.1% |
| Immigrants | Laos | 4.6 /100 | #222 | Tragic 45.1% |
| Immigrants | Cambodia | 2.7 /100 | #223 | Tragic 44.9% |
| Immigrants | Micronesia | 2.6 /100 | #224 | Tragic 44.9% |
| Dutch West Indians | 2.6 /100 | #225 | Tragic 44.9% |
| Alsatians | 2.3 /100 | #226 | Tragic 44.8% |
| Salvadorans | 1.9 /100 | #227 | Tragic 44.7% |
| Kenyans | 1.7 /100 | #228 | Tragic 44.7% |
| Immigrants | Latin America | 1.6 /100 | #229 | Tragic 44.7% |
| Soviet Union | 1.6 /100 | #230 | Tragic 44.6% |
| Houma | 1.5 /100 | #231 | Tragic 44.6% |
| Marshallese | 1.5 /100 | #232 | Tragic 44.6% |
| Immigrants | Uganda | 1.5 /100 | #233 | Tragic 44.6% |
| Immigrants | Panama | 1.3 /100 | #234 | Tragic 44.6% |
| Immigrants | Nicaragua | 1.2 /100 | #235 | Tragic 44.5% |
| Yaqui | 1.2 /100 | #236 | Tragic 44.5% |
| Comanche | 1.2 /100 | #237 | Tragic 44.5% |