Immigrants from the Azores vs Macedonian Married-couple Households
COMPARE
Immigrants from the Azores
Macedonian
Married-couple Households
Married-couple Households Comparison
Immigrants from the Azores
Macedonians
45.2%
MARRIED-COUPLE HOUSEHOLDS
5.3/ 100
METRIC RATING
218th/ 347
METRIC RANK
47.6%
MARRIED-COUPLE HOUSEHOLDS
93.9/ 100
METRIC RATING
110th/ 347
METRIC RANK
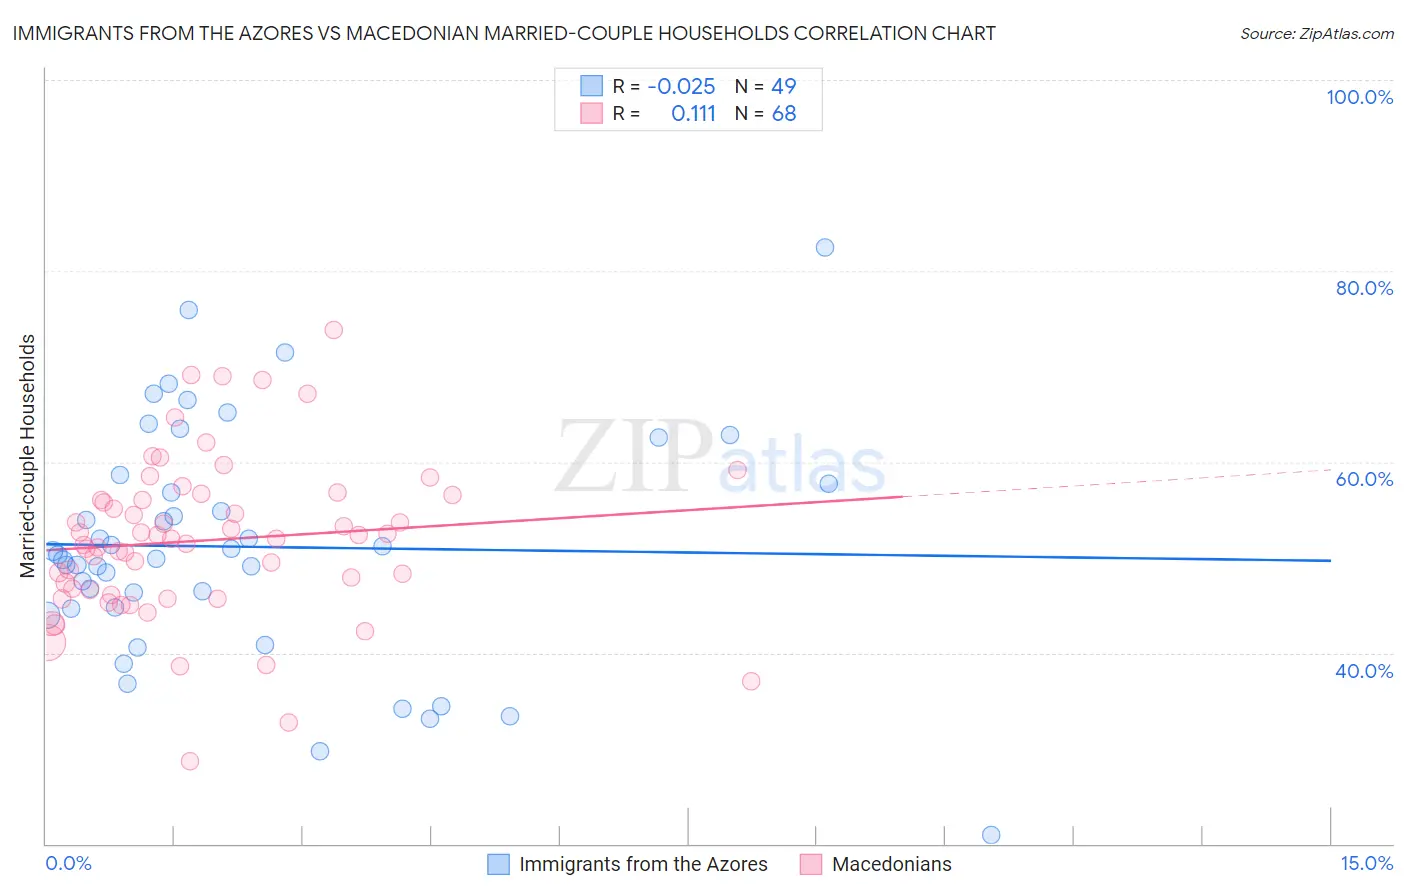
Immigrants from the Azores vs Macedonian Married-couple Households Correlation Chart
The statistical analysis conducted on geographies consisting of 46,257,310 people shows no correlation between the proportion of Immigrants from the Azores and percentage of married-couple family households in the United States with a correlation coefficient (R) of -0.025 and weighted average of 45.2%. Similarly, the statistical analysis conducted on geographies consisting of 132,608,945 people shows a poor positive correlation between the proportion of Macedonians and percentage of married-couple family households in the United States with a correlation coefficient (R) of 0.111 and weighted average of 47.6%, a difference of 5.4%.
Married-couple Households Correlation Summary
| Measurement | Immigrants from the Azores | Macedonian |
| Minimum | 21.0% | 28.7% |
| Maximum | 82.5% | 73.8% |
| Range | 61.5% | 45.2% |
| Mean | 51.1% | 51.8% |
| Median | 50.2% | 52.0% |
| Interquartile 25% (IQ1) | 44.7% | 46.3% |
| Interquartile 75% (IQ3) | 58.1% | 56.3% |
| Interquartile Range (IQR) | 13.4% | 10.0% |
| Standard Deviation (Sample) | 12.2% | 8.4% |
| Standard Deviation (Population) | 12.1% | 8.3% |
Similar Demographics by Married-couple Households
Demographics Similar to Immigrants from the Azores by Married-couple Households
In terms of married-couple households, the demographic groups most similar to Immigrants from the Azores are Nicaraguan (45.2%, a difference of 0.010%), Panamanian (45.2%, a difference of 0.030%), Immigrants from Thailand (45.2%, a difference of 0.040%), Immigrants from Nepal (45.2%, a difference of 0.050%), and Immigrants from Portugal (45.2%, a difference of 0.050%).
| Demographics | Rating | Rank | Married-couple Households |
| Immigrants | Spain | 7.3 /100 | #211 | Tragic 45.3% |
| Creek | 6.4 /100 | #212 | Tragic 45.3% |
| Yakama | 5.8 /100 | #213 | Tragic 45.2% |
| Japanese | 5.7 /100 | #214 | Tragic 45.2% |
| Immigrants | Nepal | 5.6 /100 | #215 | Tragic 45.2% |
| Immigrants | Portugal | 5.6 /100 | #216 | Tragic 45.2% |
| Panamanians | 5.5 /100 | #217 | Tragic 45.2% |
| Immigrants | Azores | 5.3 /100 | #218 | Tragic 45.2% |
| Nicaraguans | 5.3 /100 | #219 | Tragic 45.2% |
| Immigrants | Thailand | 5.1 /100 | #220 | Tragic 45.2% |
| Tlingit-Haida | 4.9 /100 | #221 | Tragic 45.1% |
| Immigrants | Laos | 4.6 /100 | #222 | Tragic 45.1% |
| Immigrants | Cambodia | 2.7 /100 | #223 | Tragic 44.9% |
| Immigrants | Micronesia | 2.6 /100 | #224 | Tragic 44.9% |
| Dutch West Indians | 2.6 /100 | #225 | Tragic 44.9% |
Demographics Similar to Macedonians by Married-couple Households
In terms of married-couple households, the demographic groups most similar to Macedonians are Syrian (47.6%, a difference of 0.0%), Immigrants from Jordan (47.7%, a difference of 0.020%), Peruvian (47.6%, a difference of 0.020%), Venezuelan (47.6%, a difference of 0.030%), and Immigrants from Europe (47.6%, a difference of 0.030%).
| Demographics | Rating | Rank | Married-couple Households |
| Hawaiians | 96.0 /100 | #103 | Exceptional 47.8% |
| Immigrants | South Africa | 96.0 /100 | #104 | Exceptional 47.8% |
| Immigrants | Czechoslovakia | 95.5 /100 | #105 | Exceptional 47.8% |
| Portuguese | 95.5 /100 | #106 | Exceptional 47.8% |
| Estonians | 94.7 /100 | #107 | Exceptional 47.7% |
| Immigrants | Japan | 94.4 /100 | #108 | Exceptional 47.7% |
| Immigrants | Jordan | 94.1 /100 | #109 | Exceptional 47.7% |
| Macedonians | 93.9 /100 | #110 | Exceptional 47.6% |
| Syrians | 93.9 /100 | #111 | Exceptional 47.6% |
| Peruvians | 93.8 /100 | #112 | Exceptional 47.6% |
| Venezuelans | 93.8 /100 | #113 | Exceptional 47.6% |
| Immigrants | Europe | 93.7 /100 | #114 | Exceptional 47.6% |
| Slovaks | 92.9 /100 | #115 | Exceptional 47.6% |
| Argentineans | 92.5 /100 | #116 | Exceptional 47.5% |
| French Canadians | 92.4 /100 | #117 | Exceptional 47.5% |