Immigrants from the Azores vs Immigrants from Middle Africa Married-couple Households
COMPARE
Immigrants from the Azores
Immigrants from Middle Africa
Married-couple Households
Married-couple Households Comparison
Immigrants from the Azores
Immigrants from Middle Africa
45.2%
MARRIED-COUPLE HOUSEHOLDS
5.3/ 100
METRIC RATING
218th/ 347
METRIC RANK
41.8%
MARRIED-COUPLE HOUSEHOLDS
0.0/ 100
METRIC RATING
298th/ 347
METRIC RANK
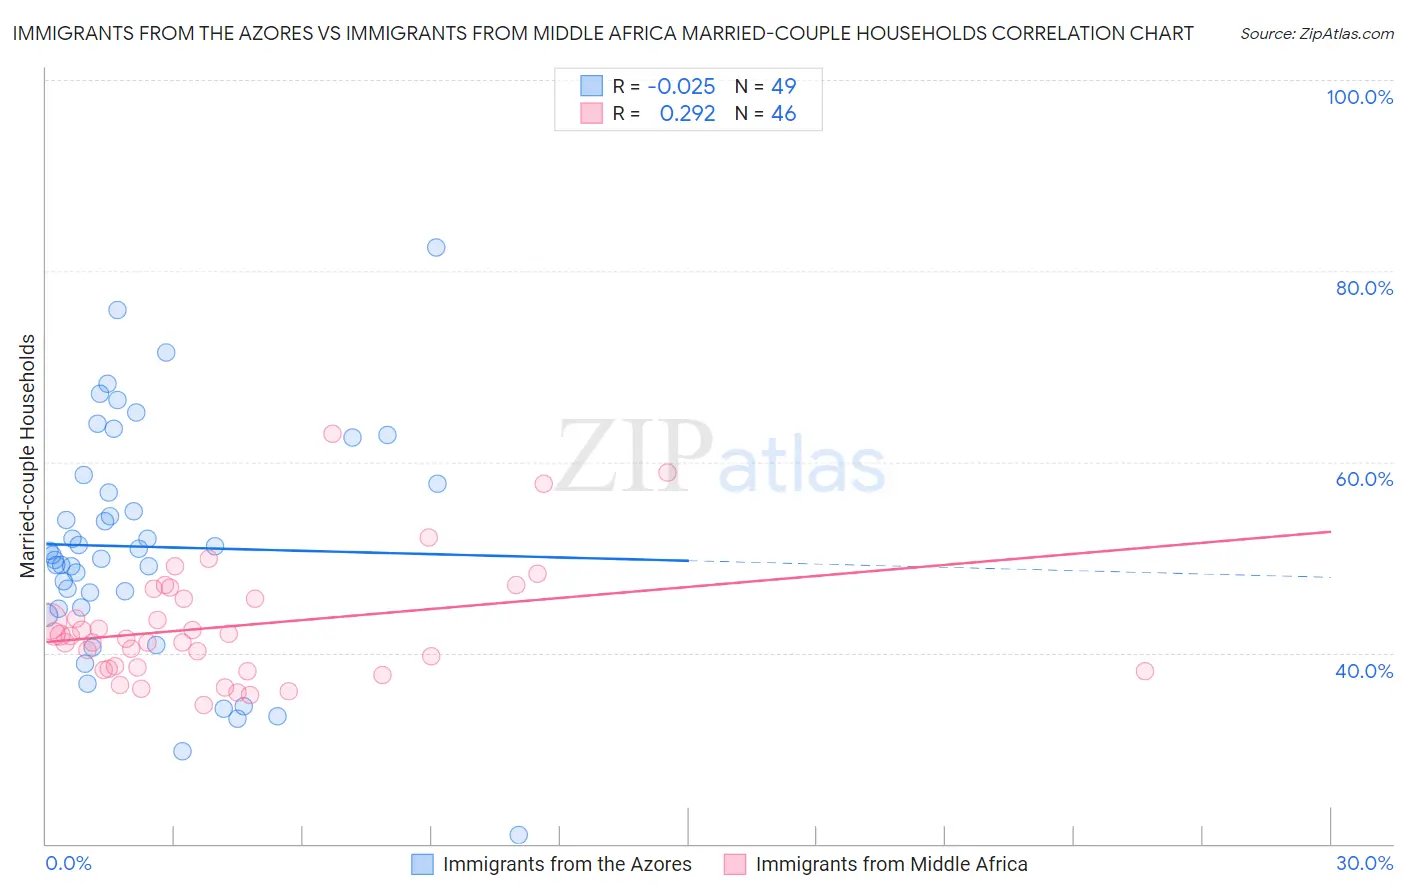
Immigrants from the Azores vs Immigrants from Middle Africa Married-couple Households Correlation Chart
The statistical analysis conducted on geographies consisting of 46,257,310 people shows no correlation between the proportion of Immigrants from the Azores and percentage of married-couple family households in the United States with a correlation coefficient (R) of -0.025 and weighted average of 45.2%. Similarly, the statistical analysis conducted on geographies consisting of 202,654,857 people shows a weak positive correlation between the proportion of Immigrants from Middle Africa and percentage of married-couple family households in the United States with a correlation coefficient (R) of 0.292 and weighted average of 41.8%, a difference of 8.1%.
Married-couple Households Correlation Summary
| Measurement | Immigrants from the Azores | Immigrants from Middle Africa |
| Minimum | 21.0% | 34.6% |
| Maximum | 82.5% | 62.9% |
| Range | 61.5% | 28.4% |
| Mean | 51.1% | 42.8% |
| Median | 50.2% | 41.6% |
| Interquartile 25% (IQ1) | 44.7% | 38.3% |
| Interquartile 75% (IQ3) | 58.1% | 45.6% |
| Interquartile Range (IQR) | 13.4% | 7.4% |
| Standard Deviation (Sample) | 12.2% | 6.2% |
| Standard Deviation (Population) | 12.1% | 6.1% |
Similar Demographics by Married-couple Households
Demographics Similar to Immigrants from the Azores by Married-couple Households
In terms of married-couple households, the demographic groups most similar to Immigrants from the Azores are Nicaraguan (45.2%, a difference of 0.010%), Panamanian (45.2%, a difference of 0.030%), Immigrants from Thailand (45.2%, a difference of 0.040%), Immigrants from Nepal (45.2%, a difference of 0.050%), and Immigrants from Portugal (45.2%, a difference of 0.050%).
| Demographics | Rating | Rank | Married-couple Households |
| Immigrants | Spain | 7.3 /100 | #211 | Tragic 45.3% |
| Creek | 6.4 /100 | #212 | Tragic 45.3% |
| Yakama | 5.8 /100 | #213 | Tragic 45.2% |
| Japanese | 5.7 /100 | #214 | Tragic 45.2% |
| Immigrants | Nepal | 5.6 /100 | #215 | Tragic 45.2% |
| Immigrants | Portugal | 5.6 /100 | #216 | Tragic 45.2% |
| Panamanians | 5.5 /100 | #217 | Tragic 45.2% |
| Immigrants | Azores | 5.3 /100 | #218 | Tragic 45.2% |
| Nicaraguans | 5.3 /100 | #219 | Tragic 45.2% |
| Immigrants | Thailand | 5.1 /100 | #220 | Tragic 45.2% |
| Tlingit-Haida | 4.9 /100 | #221 | Tragic 45.1% |
| Immigrants | Laos | 4.6 /100 | #222 | Tragic 45.1% |
| Immigrants | Cambodia | 2.7 /100 | #223 | Tragic 44.9% |
| Immigrants | Micronesia | 2.6 /100 | #224 | Tragic 44.9% |
| Dutch West Indians | 2.6 /100 | #225 | Tragic 44.9% |
Demographics Similar to Immigrants from Middle Africa by Married-couple Households
In terms of married-couple households, the demographic groups most similar to Immigrants from Middle Africa are Arapaho (41.8%, a difference of 0.040%), Immigrants from Ghana (41.8%, a difference of 0.080%), Immigrants from Belize (41.8%, a difference of 0.090%), Immigrants from Bahamas (41.7%, a difference of 0.30%), and Immigrants from Sudan (41.9%, a difference of 0.33%).
| Demographics | Rating | Rank | Married-couple Households |
| Paiute | 0.0 /100 | #291 | Tragic 42.1% |
| Indonesians | 0.0 /100 | #292 | Tragic 42.0% |
| Menominee | 0.0 /100 | #293 | Tragic 42.0% |
| Immigrants | Yemen | 0.0 /100 | #294 | Tragic 42.0% |
| Kiowa | 0.0 /100 | #295 | Tragic 42.0% |
| Immigrants | Sudan | 0.0 /100 | #296 | Tragic 41.9% |
| Arapaho | 0.0 /100 | #297 | Tragic 41.8% |
| Immigrants | Middle Africa | 0.0 /100 | #298 | Tragic 41.8% |
| Immigrants | Ghana | 0.0 /100 | #299 | Tragic 41.8% |
| Immigrants | Belize | 0.0 /100 | #300 | Tragic 41.8% |
| Immigrants | Bahamas | 0.0 /100 | #301 | Tragic 41.7% |
| Immigrants | Honduras | 0.0 /100 | #302 | Tragic 41.6% |
| Sub-Saharan Africans | 0.0 /100 | #303 | Tragic 41.6% |
| Immigrants | Guyana | 0.0 /100 | #304 | Tragic 41.6% |
| Sioux | 0.0 /100 | #305 | Tragic 41.5% |