Zimbabwean vs French American Indian Male Disability
COMPARE
Zimbabwean
French American Indian
Male Disability
Male Disability Comparison
Zimbabweans
French American Indians
10.6%
MALE DISABILITY
98.4/ 100
METRIC RATING
79th/ 347
METRIC RANK
13.4%
MALE DISABILITY
0.0/ 100
METRIC RATING
308th/ 347
METRIC RANK
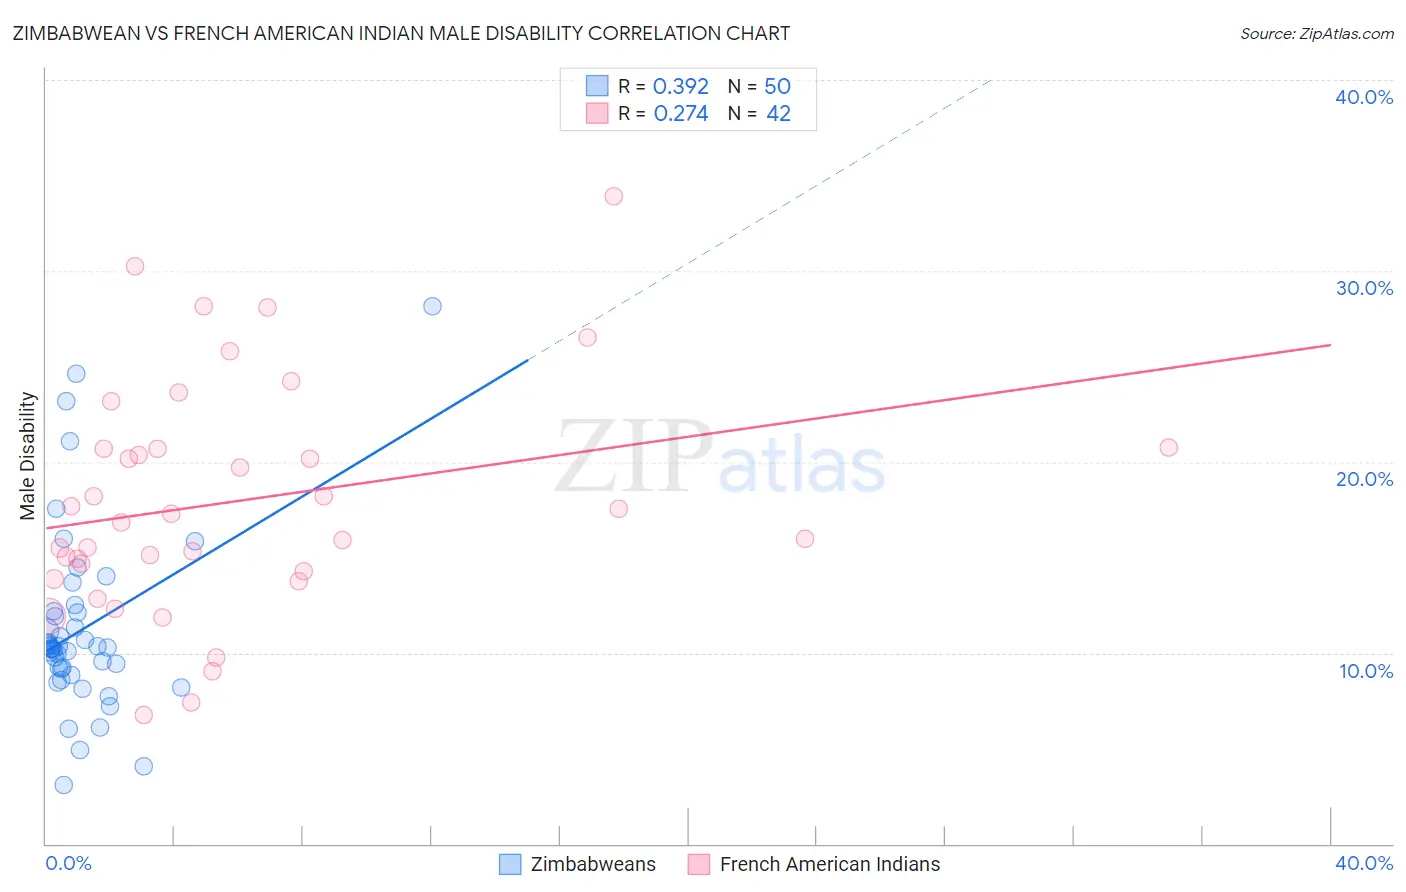
Zimbabwean vs French American Indian Male Disability Correlation Chart
The statistical analysis conducted on geographies consisting of 69,206,379 people shows a mild positive correlation between the proportion of Zimbabweans and percentage of males with a disability in the United States with a correlation coefficient (R) of 0.392 and weighted average of 10.6%. Similarly, the statistical analysis conducted on geographies consisting of 131,973,508 people shows a weak positive correlation between the proportion of French American Indians and percentage of males with a disability in the United States with a correlation coefficient (R) of 0.274 and weighted average of 13.4%, a difference of 26.3%.
Male Disability Correlation Summary
| Measurement | Zimbabwean | French American Indian |
| Minimum | 3.1% | 6.8% |
| Maximum | 28.1% | 33.9% |
| Range | 25.0% | 27.2% |
| Mean | 11.3% | 17.9% |
| Median | 10.2% | 17.0% |
| Interquartile 25% (IQ1) | 9.2% | 14.3% |
| Interquartile 75% (IQ3) | 12.1% | 20.7% |
| Interquartile Range (IQR) | 2.9% | 6.4% |
| Standard Deviation (Sample) | 4.8% | 6.1% |
| Standard Deviation (Population) | 4.8% | 6.0% |
Similar Demographics by Male Disability
Demographics Similar to Zimbabweans by Male Disability
In terms of male disability, the demographic groups most similar to Zimbabweans are Immigrants from Jordan (10.6%, a difference of 0.020%), Immigrants from Chile (10.6%, a difference of 0.080%), Immigrants from Guyana (10.6%, a difference of 0.15%), Immigrants from Poland (10.6%, a difference of 0.21%), and Bulgarian (10.6%, a difference of 0.22%).
| Demographics | Rating | Rank | Male Disability |
| Immigrants | Serbia | 99.0 /100 | #72 | Exceptional 10.5% |
| Immigrants | Lithuania | 98.9 /100 | #73 | Exceptional 10.5% |
| Immigrants | Lebanon | 98.8 /100 | #74 | Exceptional 10.5% |
| Sierra Leoneans | 98.7 /100 | #75 | Exceptional 10.5% |
| Immigrants | Sierra Leone | 98.7 /100 | #76 | Exceptional 10.5% |
| Laotians | 98.6 /100 | #77 | Exceptional 10.6% |
| Immigrants | Russia | 98.6 /100 | #78 | Exceptional 10.6% |
| Zimbabweans | 98.4 /100 | #79 | Exceptional 10.6% |
| Immigrants | Jordan | 98.4 /100 | #80 | Exceptional 10.6% |
| Immigrants | Chile | 98.3 /100 | #81 | Exceptional 10.6% |
| Immigrants | Guyana | 98.2 /100 | #82 | Exceptional 10.6% |
| Immigrants | Poland | 98.1 /100 | #83 | Exceptional 10.6% |
| Bulgarians | 98.1 /100 | #84 | Exceptional 10.6% |
| Sri Lankans | 97.9 /100 | #85 | Exceptional 10.6% |
| Immigrants | Ireland | 97.9 /100 | #86 | Exceptional 10.6% |
Demographics Similar to French American Indians by Male Disability
In terms of male disability, the demographic groups most similar to French American Indians are Arapaho (13.3%, a difference of 0.15%), Spanish American (13.3%, a difference of 0.38%), Blackfeet (13.4%, a difference of 0.42%), Immigrants from the Azores (13.4%, a difference of 0.56%), and French Canadian (13.3%, a difference of 0.58%).
| Demographics | Rating | Rank | Male Disability |
| French | 0.0 /100 | #301 | Tragic 13.0% |
| Crow | 0.0 /100 | #302 | Tragic 13.1% |
| Scotch-Irish | 0.0 /100 | #303 | Tragic 13.2% |
| Blacks/African Americans | 0.0 /100 | #304 | Tragic 13.2% |
| French Canadians | 0.0 /100 | #305 | Tragic 13.3% |
| Spanish Americans | 0.0 /100 | #306 | Tragic 13.3% |
| Arapaho | 0.0 /100 | #307 | Tragic 13.3% |
| French American Indians | 0.0 /100 | #308 | Tragic 13.4% |
| Blackfeet | 0.0 /100 | #309 | Tragic 13.4% |
| Immigrants | Azores | 0.0 /100 | #310 | Tragic 13.4% |
| Delaware | 0.0 /100 | #311 | Tragic 13.5% |
| Yakama | 0.0 /100 | #312 | Tragic 13.5% |
| Puget Sound Salish | 0.0 /100 | #313 | Tragic 13.5% |
| Aleuts | 0.0 /100 | #314 | Tragic 13.5% |
| Iroquois | 0.0 /100 | #315 | Tragic 13.6% |