Zimbabwean vs Immigrants from Burma/Myanmar Male Disability
COMPARE
Zimbabwean
Immigrants from Burma/Myanmar
Male Disability
Male Disability Comparison
Zimbabweans
Immigrants from Burma/Myanmar
10.6%
MALE DISABILITY
98.4/ 100
METRIC RATING
79th/ 347
METRIC RANK
11.2%
MALE DISABILITY
50.4/ 100
METRIC RATING
173rd/ 347
METRIC RANK
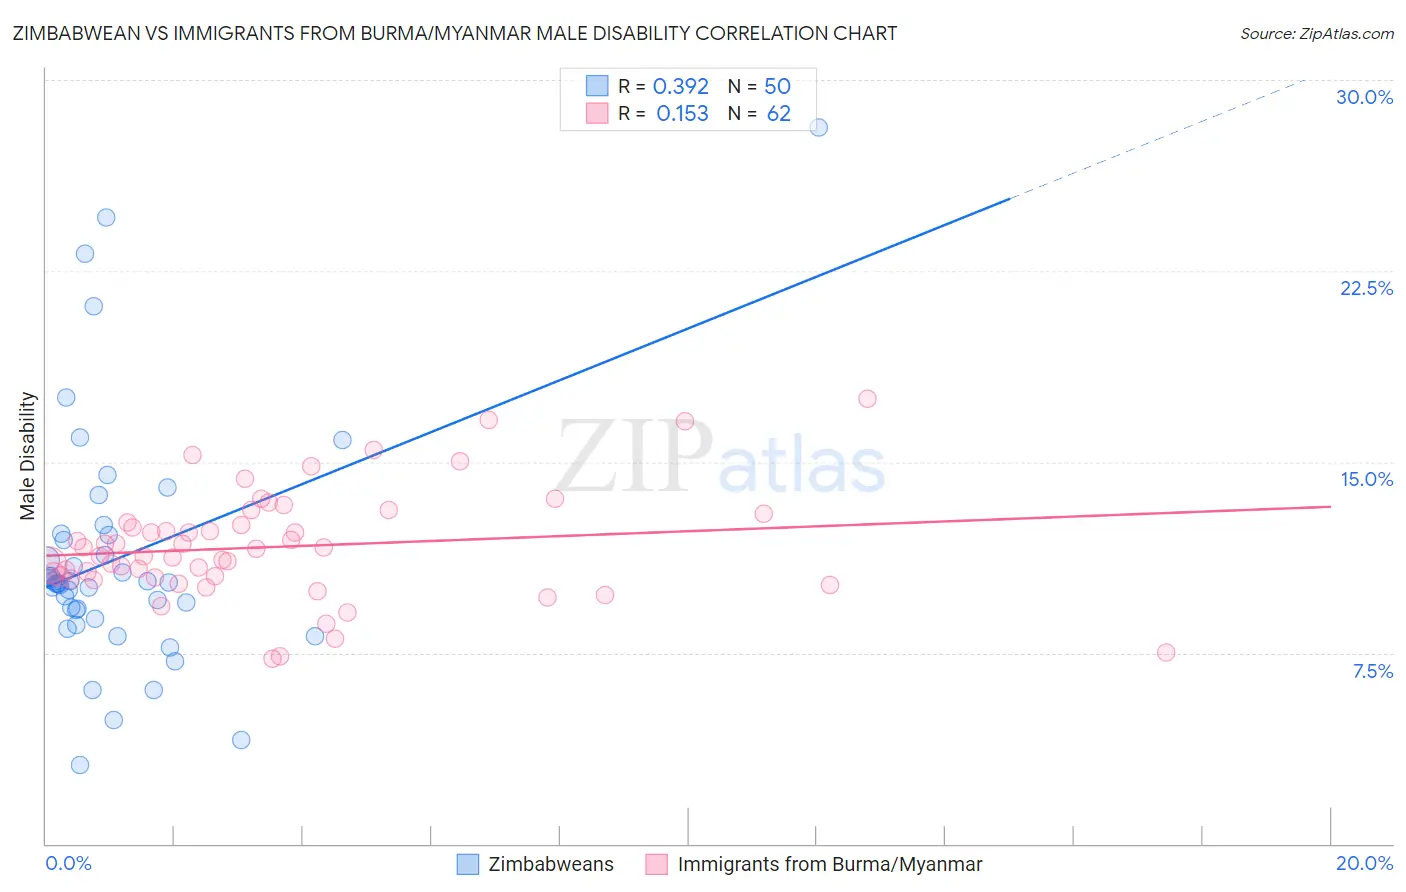
Zimbabwean vs Immigrants from Burma/Myanmar Male Disability Correlation Chart
The statistical analysis conducted on geographies consisting of 69,206,379 people shows a mild positive correlation between the proportion of Zimbabweans and percentage of males with a disability in the United States with a correlation coefficient (R) of 0.392 and weighted average of 10.6%. Similarly, the statistical analysis conducted on geographies consisting of 172,332,425 people shows a poor positive correlation between the proportion of Immigrants from Burma/Myanmar and percentage of males with a disability in the United States with a correlation coefficient (R) of 0.153 and weighted average of 11.2%, a difference of 6.0%.
Male Disability Correlation Summary
| Measurement | Zimbabwean | Immigrants from Burma/Myanmar |
| Minimum | 3.1% | 7.3% |
| Maximum | 28.1% | 17.5% |
| Range | 25.0% | 10.2% |
| Mean | 11.3% | 11.7% |
| Median | 10.2% | 11.4% |
| Interquartile 25% (IQ1) | 9.2% | 10.5% |
| Interquartile 75% (IQ3) | 12.1% | 12.6% |
| Interquartile Range (IQR) | 2.9% | 2.1% |
| Standard Deviation (Sample) | 4.8% | 2.2% |
| Standard Deviation (Population) | 4.8% | 2.1% |
Similar Demographics by Male Disability
Demographics Similar to Zimbabweans by Male Disability
In terms of male disability, the demographic groups most similar to Zimbabweans are Immigrants from Jordan (10.6%, a difference of 0.020%), Immigrants from Chile (10.6%, a difference of 0.080%), Immigrants from Guyana (10.6%, a difference of 0.15%), Immigrants from Poland (10.6%, a difference of 0.21%), and Bulgarian (10.6%, a difference of 0.22%).
| Demographics | Rating | Rank | Male Disability |
| Immigrants | Serbia | 99.0 /100 | #72 | Exceptional 10.5% |
| Immigrants | Lithuania | 98.9 /100 | #73 | Exceptional 10.5% |
| Immigrants | Lebanon | 98.8 /100 | #74 | Exceptional 10.5% |
| Sierra Leoneans | 98.7 /100 | #75 | Exceptional 10.5% |
| Immigrants | Sierra Leone | 98.7 /100 | #76 | Exceptional 10.5% |
| Laotians | 98.6 /100 | #77 | Exceptional 10.6% |
| Immigrants | Russia | 98.6 /100 | #78 | Exceptional 10.6% |
| Zimbabweans | 98.4 /100 | #79 | Exceptional 10.6% |
| Immigrants | Jordan | 98.4 /100 | #80 | Exceptional 10.6% |
| Immigrants | Chile | 98.3 /100 | #81 | Exceptional 10.6% |
| Immigrants | Guyana | 98.2 /100 | #82 | Exceptional 10.6% |
| Immigrants | Poland | 98.1 /100 | #83 | Exceptional 10.6% |
| Bulgarians | 98.1 /100 | #84 | Exceptional 10.6% |
| Sri Lankans | 97.9 /100 | #85 | Exceptional 10.6% |
| Immigrants | Ireland | 97.9 /100 | #86 | Exceptional 10.6% |
Demographics Similar to Immigrants from Burma/Myanmar by Male Disability
In terms of male disability, the demographic groups most similar to Immigrants from Burma/Myanmar are Romanian (11.2%, a difference of 0.020%), Maltese (11.2%, a difference of 0.020%), Immigrants from Honduras (11.2%, a difference of 0.10%), Haitian (11.2%, a difference of 0.12%), and New Zealander (11.2%, a difference of 0.14%).
| Demographics | Rating | Rank | Male Disability |
| Immigrants | Hungary | 61.2 /100 | #166 | Good 11.1% |
| Immigrants | Southern Europe | 54.4 /100 | #167 | Average 11.2% |
| Immigrants | Latin America | 54.0 /100 | #168 | Average 11.2% |
| Barbadians | 53.4 /100 | #169 | Average 11.2% |
| New Zealanders | 52.9 /100 | #170 | Average 11.2% |
| Haitians | 52.5 /100 | #171 | Average 11.2% |
| Romanians | 50.7 /100 | #172 | Average 11.2% |
| Immigrants | Burma/Myanmar | 50.4 /100 | #173 | Average 11.2% |
| Maltese | 50.0 /100 | #174 | Average 11.2% |
| Immigrants | Honduras | 48.7 /100 | #175 | Average 11.2% |
| Syrians | 46.6 /100 | #176 | Average 11.2% |
| Immigrants | Norway | 44.2 /100 | #177 | Average 11.3% |
| Australians | 42.2 /100 | #178 | Average 11.3% |
| Immigrants | Caribbean | 41.4 /100 | #179 | Average 11.3% |
| Hondurans | 41.1 /100 | #180 | Average 11.3% |