Zimbabwean vs South American Indian Male Disability
COMPARE
Zimbabwean
South American Indian
Male Disability
Male Disability Comparison
Zimbabweans
South American Indians
10.6%
MALE DISABILITY
98.4/ 100
METRIC RATING
79th/ 347
METRIC RANK
10.9%
MALE DISABILITY
88.1/ 100
METRIC RATING
124th/ 347
METRIC RANK
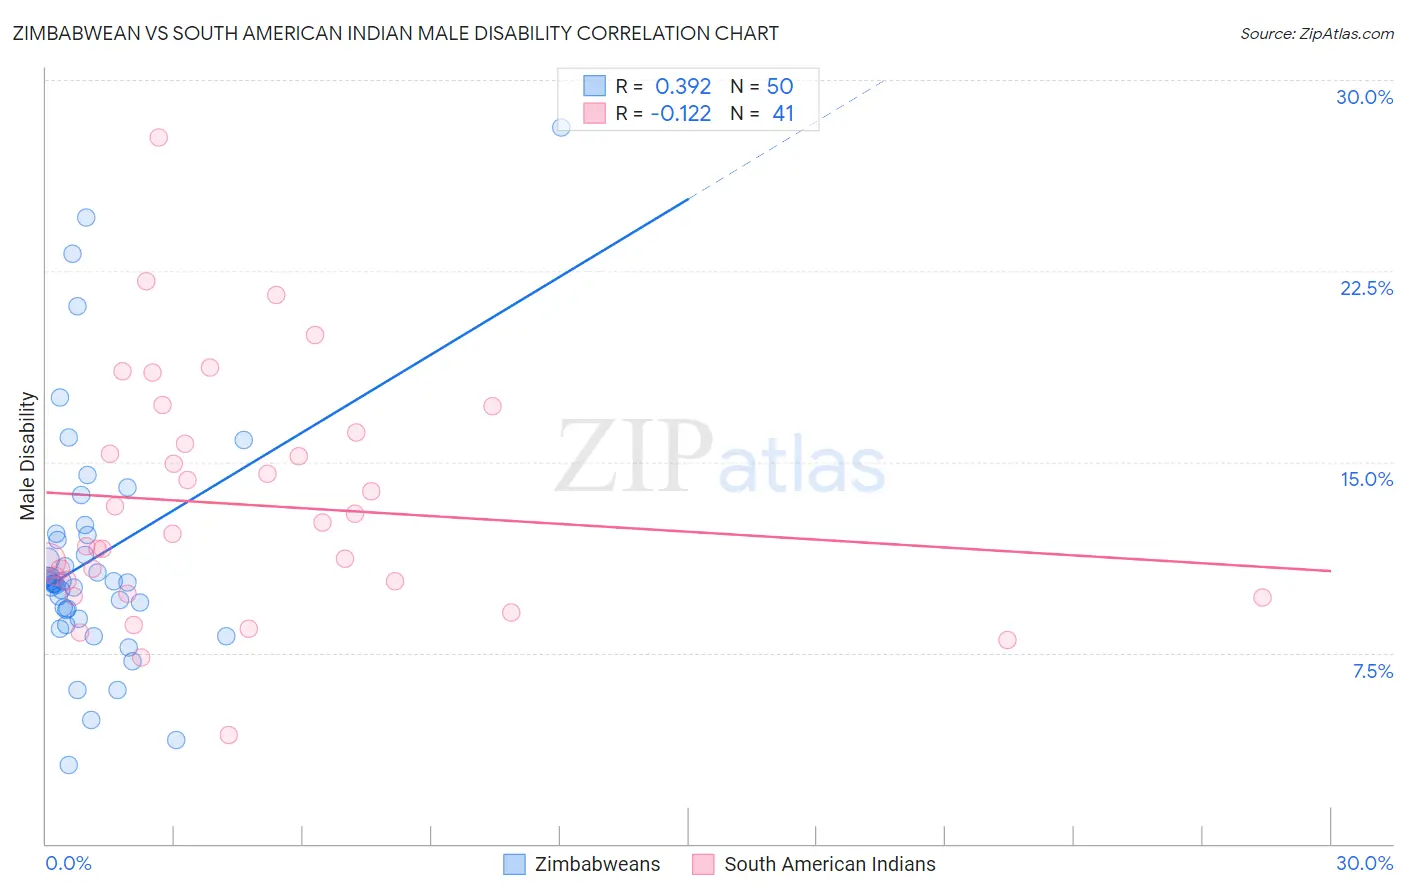
Zimbabwean vs South American Indian Male Disability Correlation Chart
The statistical analysis conducted on geographies consisting of 69,206,379 people shows a mild positive correlation between the proportion of Zimbabweans and percentage of males with a disability in the United States with a correlation coefficient (R) of 0.392 and weighted average of 10.6%. Similarly, the statistical analysis conducted on geographies consisting of 164,560,942 people shows a poor negative correlation between the proportion of South American Indians and percentage of males with a disability in the United States with a correlation coefficient (R) of -0.122 and weighted average of 10.9%, a difference of 3.1%.
Male Disability Correlation Summary
| Measurement | Zimbabwean | South American Indian |
| Minimum | 3.1% | 4.3% |
| Maximum | 28.1% | 27.7% |
| Range | 25.0% | 23.4% |
| Mean | 11.3% | 13.3% |
| Median | 10.2% | 12.2% |
| Interquartile 25% (IQ1) | 9.2% | 10.1% |
| Interquartile 75% (IQ3) | 12.1% | 15.9% |
| Interquartile Range (IQR) | 2.9% | 5.9% |
| Standard Deviation (Sample) | 4.8% | 4.7% |
| Standard Deviation (Population) | 4.8% | 4.6% |
Similar Demographics by Male Disability
Demographics Similar to Zimbabweans by Male Disability
In terms of male disability, the demographic groups most similar to Zimbabweans are Immigrants from Jordan (10.6%, a difference of 0.020%), Immigrants from Chile (10.6%, a difference of 0.080%), Immigrants from Guyana (10.6%, a difference of 0.15%), Immigrants from Poland (10.6%, a difference of 0.21%), and Bulgarian (10.6%, a difference of 0.22%).
| Demographics | Rating | Rank | Male Disability |
| Immigrants | Serbia | 99.0 /100 | #72 | Exceptional 10.5% |
| Immigrants | Lithuania | 98.9 /100 | #73 | Exceptional 10.5% |
| Immigrants | Lebanon | 98.8 /100 | #74 | Exceptional 10.5% |
| Sierra Leoneans | 98.7 /100 | #75 | Exceptional 10.5% |
| Immigrants | Sierra Leone | 98.7 /100 | #76 | Exceptional 10.5% |
| Laotians | 98.6 /100 | #77 | Exceptional 10.6% |
| Immigrants | Russia | 98.6 /100 | #78 | Exceptional 10.6% |
| Zimbabweans | 98.4 /100 | #79 | Exceptional 10.6% |
| Immigrants | Jordan | 98.4 /100 | #80 | Exceptional 10.6% |
| Immigrants | Chile | 98.3 /100 | #81 | Exceptional 10.6% |
| Immigrants | Guyana | 98.2 /100 | #82 | Exceptional 10.6% |
| Immigrants | Poland | 98.1 /100 | #83 | Exceptional 10.6% |
| Bulgarians | 98.1 /100 | #84 | Exceptional 10.6% |
| Sri Lankans | 97.9 /100 | #85 | Exceptional 10.6% |
| Immigrants | Ireland | 97.9 /100 | #86 | Exceptional 10.6% |
Demographics Similar to South American Indians by Male Disability
In terms of male disability, the demographic groups most similar to South American Indians are Immigrants from North Macedonia (10.9%, a difference of 0.0%), Immigrants from Czechoslovakia (10.9%, a difference of 0.040%), Immigrants from Ghana (10.9%, a difference of 0.14%), Immigrants from South Eastern Asia (10.9%, a difference of 0.15%), and Immigrants from Trinidad and Tobago (10.9%, a difference of 0.16%).
| Demographics | Rating | Rank | Male Disability |
| Eastern Europeans | 90.6 /100 | #117 | Exceptional 10.9% |
| Immigrants | Cuba | 90.2 /100 | #118 | Exceptional 10.9% |
| Armenians | 90.1 /100 | #119 | Exceptional 10.9% |
| Immigrants | Africa | 89.4 /100 | #120 | Excellent 10.9% |
| Immigrants | South Eastern Asia | 89.2 /100 | #121 | Excellent 10.9% |
| Immigrants | Ghana | 89.0 /100 | #122 | Excellent 10.9% |
| Immigrants | Czechoslovakia | 88.4 /100 | #123 | Excellent 10.9% |
| South American Indians | 88.1 /100 | #124 | Excellent 10.9% |
| Immigrants | North Macedonia | 88.1 /100 | #125 | Excellent 10.9% |
| Immigrants | Trinidad and Tobago | 86.9 /100 | #126 | Excellent 10.9% |
| Immigrants | Ukraine | 86.8 /100 | #127 | Excellent 10.9% |
| Immigrants | Latvia | 85.5 /100 | #128 | Excellent 10.9% |
| Immigrants | Philippines | 85.4 /100 | #129 | Excellent 10.9% |
| Brazilians | 85.4 /100 | #130 | Excellent 10.9% |
| Macedonians | 84.2 /100 | #131 | Excellent 11.0% |