Zimbabwean vs French American Indian Master's Degree
COMPARE
Zimbabwean
French American Indian
Master's Degree
Master's Degree Comparison
Zimbabweans
French American Indians
17.7%
MASTER'S DEGREE
99.7/ 100
METRIC RATING
73rd/ 347
METRIC RANK
12.7%
MASTER'S DEGREE
1.0/ 100
METRIC RATING
252nd/ 347
METRIC RANK
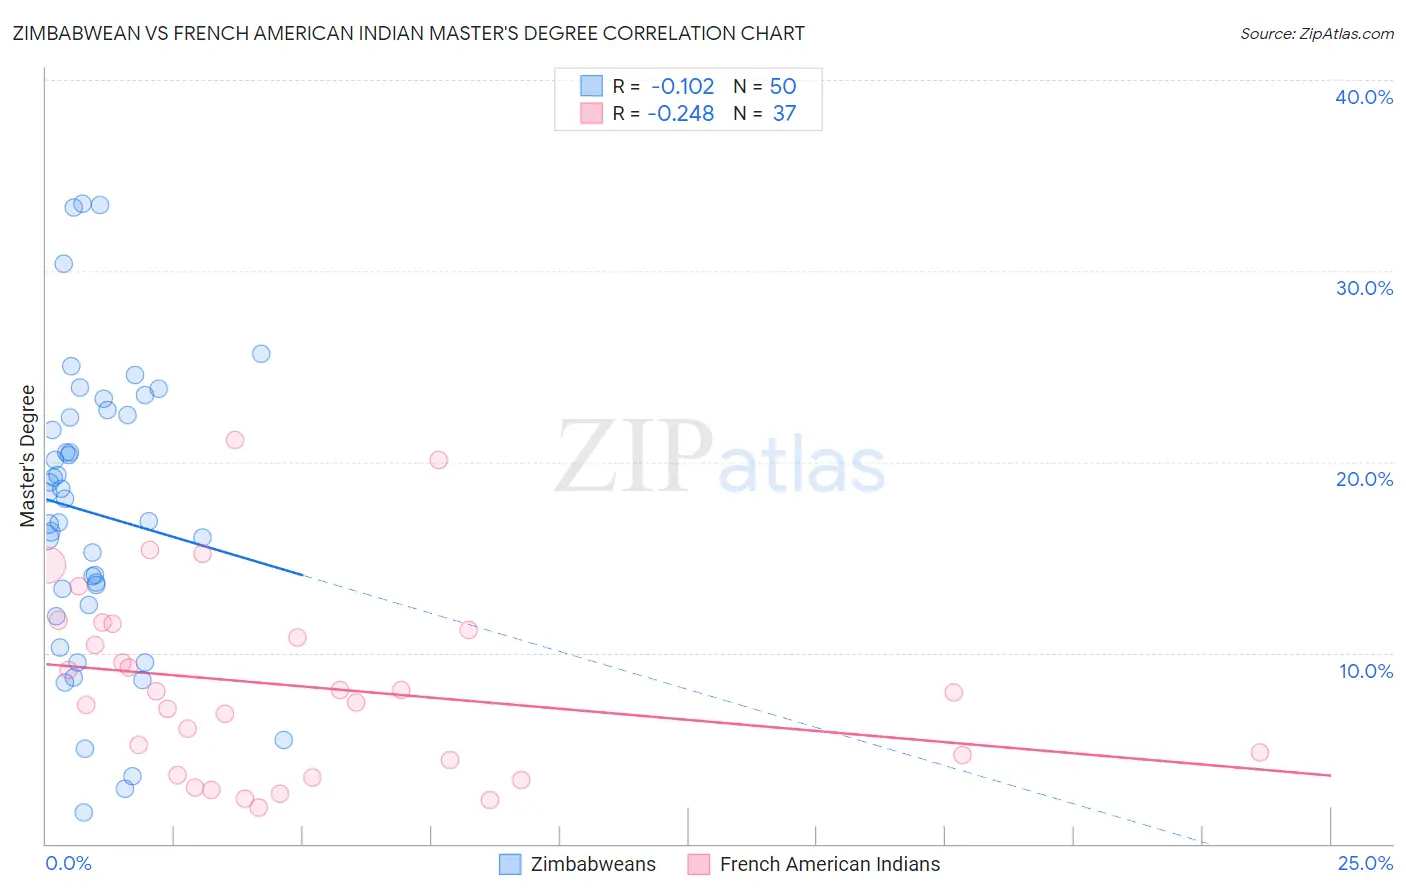
Zimbabwean vs French American Indian Master's Degree Correlation Chart
The statistical analysis conducted on geographies consisting of 69,201,212 people shows a poor negative correlation between the proportion of Zimbabweans and percentage of population with at least master's degree education in the United States with a correlation coefficient (R) of -0.102 and weighted average of 17.7%. Similarly, the statistical analysis conducted on geographies consisting of 131,966,823 people shows a weak negative correlation between the proportion of French American Indians and percentage of population with at least master's degree education in the United States with a correlation coefficient (R) of -0.248 and weighted average of 12.7%, a difference of 39.4%.
Master's Degree Correlation Summary
| Measurement | Zimbabwean | French American Indian |
| Minimum | 1.7% | 1.9% |
| Maximum | 33.5% | 21.1% |
| Range | 31.8% | 19.2% |
| Mean | 17.3% | 8.3% |
| Median | 17.5% | 7.9% |
| Interquartile 25% (IQ1) | 12.5% | 4.0% |
| Interquartile 75% (IQ3) | 22.4% | 11.4% |
| Interquartile Range (IQR) | 9.9% | 7.4% |
| Standard Deviation (Sample) | 7.7% | 4.9% |
| Standard Deviation (Population) | 7.6% | 4.8% |
Similar Demographics by Master's Degree
Demographics Similar to Zimbabweans by Master's Degree
In terms of master's degree, the demographic groups most similar to Zimbabweans are Lithuanian (17.7%, a difference of 0.11%), Immigrants from Pakistan (17.8%, a difference of 0.28%), Immigrants from Romania (17.7%, a difference of 0.31%), Immigrants from Western Europe (17.8%, a difference of 0.57%), and Egyptian (17.6%, a difference of 0.69%).
| Demographics | Rating | Rank | Master's Degree |
| Ethiopians | 99.8 /100 | #66 | Exceptional 18.0% |
| Immigrants | Argentina | 99.8 /100 | #67 | Exceptional 18.0% |
| Immigrants | Ethiopia | 99.8 /100 | #68 | Exceptional 17.9% |
| Immigrants | Uzbekistan | 99.8 /100 | #69 | Exceptional 17.9% |
| Immigrants | Western Europe | 99.8 /100 | #70 | Exceptional 17.8% |
| Immigrants | Pakistan | 99.7 /100 | #71 | Exceptional 17.8% |
| Lithuanians | 99.7 /100 | #72 | Exceptional 17.7% |
| Zimbabweans | 99.7 /100 | #73 | Exceptional 17.7% |
| Immigrants | Romania | 99.7 /100 | #74 | Exceptional 17.7% |
| Egyptians | 99.6 /100 | #75 | Exceptional 17.6% |
| Immigrants | Indonesia | 99.6 /100 | #76 | Exceptional 17.6% |
| Immigrants | Eastern Europe | 99.6 /100 | #77 | Exceptional 17.6% |
| Immigrants | Hungary | 99.6 /100 | #78 | Exceptional 17.5% |
| Immigrants | Lebanon | 99.6 /100 | #79 | Exceptional 17.5% |
| Carpatho Rusyns | 99.6 /100 | #80 | Exceptional 17.5% |
Demographics Similar to French American Indians by Master's Degree
In terms of master's degree, the demographic groups most similar to French American Indians are Immigrants from Dominica (12.6%, a difference of 0.54%), Indonesian (12.6%, a difference of 0.59%), Immigrants from Congo (12.6%, a difference of 0.61%), Immigrants from Portugal (12.6%, a difference of 0.69%), and Tlingit-Haida (12.8%, a difference of 0.98%).
| Demographics | Rating | Rank | Master's Degree |
| Immigrants | Bahamas | 1.4 /100 | #245 | Tragic 12.9% |
| Immigrants | Cambodia | 1.4 /100 | #246 | Tragic 12.9% |
| Iroquois | 1.4 /100 | #247 | Tragic 12.9% |
| Africans | 1.4 /100 | #248 | Tragic 12.9% |
| Cree | 1.3 /100 | #249 | Tragic 12.8% |
| Liberians | 1.3 /100 | #250 | Tragic 12.8% |
| Tlingit-Haida | 1.3 /100 | #251 | Tragic 12.8% |
| French American Indians | 1.0 /100 | #252 | Tragic 12.7% |
| Immigrants | Dominica | 0.8 /100 | #253 | Tragic 12.6% |
| Indonesians | 0.8 /100 | #254 | Tragic 12.6% |
| Immigrants | Congo | 0.8 /100 | #255 | Tragic 12.6% |
| Immigrants | Portugal | 0.8 /100 | #256 | Tragic 12.6% |
| Osage | 0.7 /100 | #257 | Tragic 12.6% |
| Immigrants | Liberia | 0.6 /100 | #258 | Tragic 12.5% |
| Japanese | 0.6 /100 | #259 | Tragic 12.5% |