Samoan vs Syrian Female Disability
COMPARE
Samoan
Syrian
Female Disability
Female Disability Comparison
Samoans
Syrians
12.4%
FEMALE DISABILITY
13.4/ 100
METRIC RATING
215th/ 347
METRIC RANK
12.1%
FEMALE DISABILITY
76.9/ 100
METRIC RATING
154th/ 347
METRIC RANK
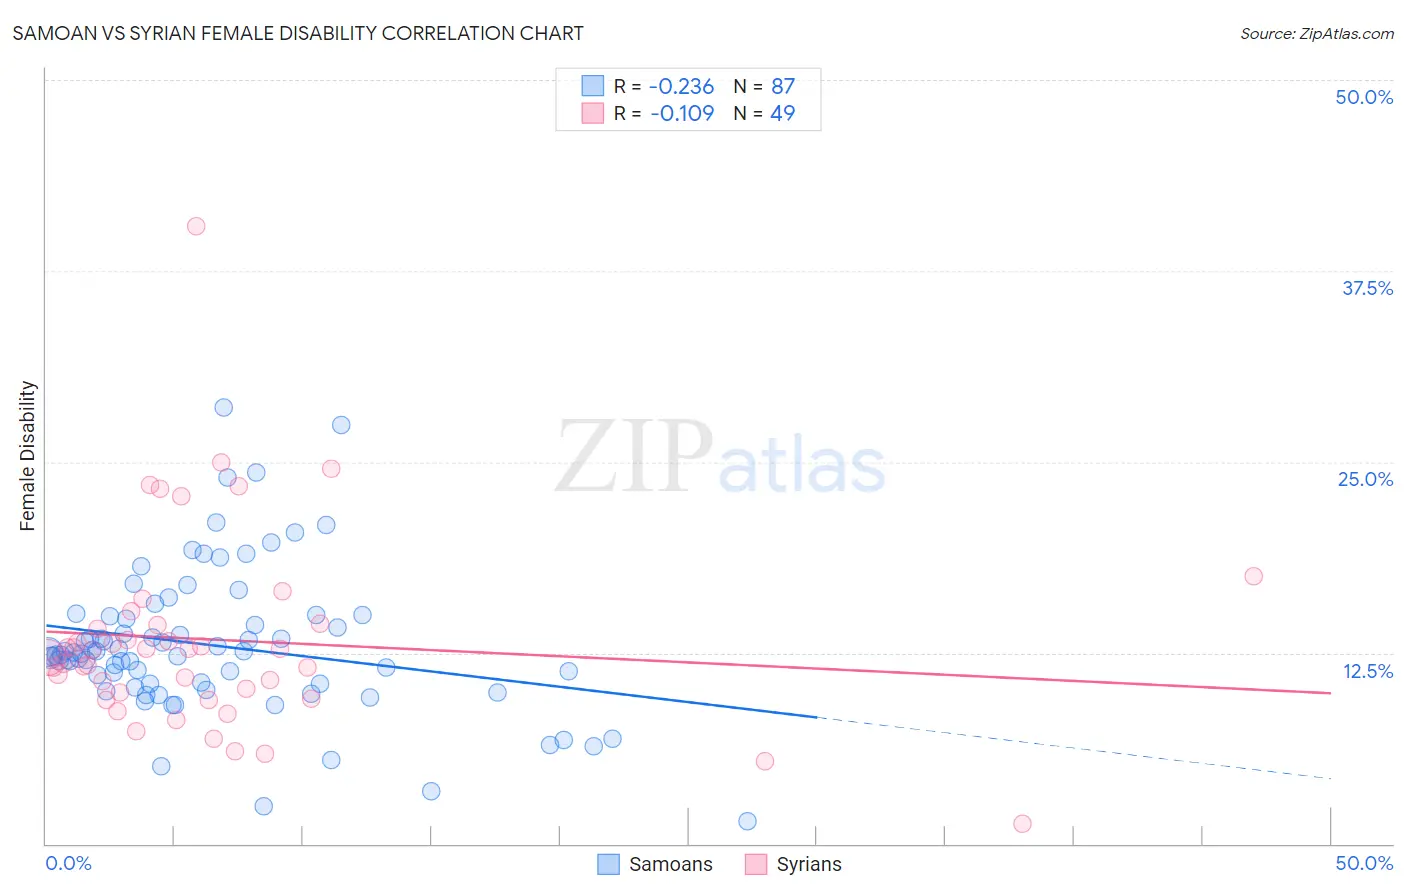
Samoan vs Syrian Female Disability Correlation Chart
The statistical analysis conducted on geographies consisting of 225,122,232 people shows a weak negative correlation between the proportion of Samoans and percentage of females with a disability in the United States with a correlation coefficient (R) of -0.236 and weighted average of 12.4%. Similarly, the statistical analysis conducted on geographies consisting of 266,312,876 people shows a poor negative correlation between the proportion of Syrians and percentage of females with a disability in the United States with a correlation coefficient (R) of -0.109 and weighted average of 12.1%, a difference of 2.9%.
Female Disability Correlation Summary
| Measurement | Samoan | Syrian |
| Minimum | 1.5% | 1.3% |
| Maximum | 28.6% | 40.4% |
| Range | 27.1% | 39.1% |
| Mean | 13.0% | 13.3% |
| Median | 12.4% | 12.7% |
| Interquartile 25% (IQ1) | 10.4% | 9.7% |
| Interquartile 75% (IQ3) | 14.9% | 14.4% |
| Interquartile Range (IQR) | 4.5% | 4.7% |
| Standard Deviation (Sample) | 4.8% | 6.5% |
| Standard Deviation (Population) | 4.8% | 6.4% |
Similar Demographics by Female Disability
Demographics Similar to Samoans by Female Disability
In terms of female disability, the demographic groups most similar to Samoans are Panamanian (12.4%, a difference of 0.0%), Immigrants from Burma/Myanmar (12.4%, a difference of 0.010%), British (12.4%, a difference of 0.060%), Immigrants from Thailand (12.4%, a difference of 0.080%), and Immigrants from Bahamas (12.4%, a difference of 0.080%).
| Demographics | Rating | Rank | Female Disability |
| Basques | 17.5 /100 | #208 | Poor 12.4% |
| Mexicans | 15.7 /100 | #209 | Poor 12.4% |
| Swiss | 14.9 /100 | #210 | Poor 12.4% |
| Immigrants | Bosnia and Herzegovina | 14.8 /100 | #211 | Poor 12.4% |
| Ute | 14.7 /100 | #212 | Poor 12.4% |
| Immigrants | Thailand | 14.5 /100 | #213 | Poor 12.4% |
| Panamanians | 13.5 /100 | #214 | Poor 12.4% |
| Samoans | 13.4 /100 | #215 | Poor 12.4% |
| Immigrants | Burma/Myanmar | 13.3 /100 | #216 | Poor 12.4% |
| British | 12.7 /100 | #217 | Poor 12.4% |
| Immigrants | Bahamas | 12.5 /100 | #218 | Poor 12.4% |
| Europeans | 12.1 /100 | #219 | Poor 12.4% |
| Bahamians | 11.1 /100 | #220 | Poor 12.4% |
| Native Hawaiians | 10.8 /100 | #221 | Poor 12.4% |
| Italians | 10.7 /100 | #222 | Poor 12.4% |
Demographics Similar to Syrians by Female Disability
In terms of female disability, the demographic groups most similar to Syrians are Ghanaian (12.1%, a difference of 0.020%), Immigrants from Scotland (12.0%, a difference of 0.13%), Sudanese (12.0%, a difference of 0.13%), Moroccan (12.1%, a difference of 0.20%), and Icelander (12.0%, a difference of 0.22%).
| Demographics | Rating | Rank | Female Disability |
| Nigerians | 84.0 /100 | #147 | Excellent 12.0% |
| Immigrants | Kenya | 83.1 /100 | #148 | Excellent 12.0% |
| Greeks | 82.0 /100 | #149 | Excellent 12.0% |
| Immigrants | Moldova | 81.4 /100 | #150 | Excellent 12.0% |
| Icelanders | 80.7 /100 | #151 | Excellent 12.0% |
| Immigrants | Scotland | 79.3 /100 | #152 | Good 12.0% |
| Sudanese | 79.1 /100 | #153 | Good 12.0% |
| Syrians | 76.9 /100 | #154 | Good 12.1% |
| Ghanaians | 76.6 /100 | #155 | Good 12.1% |
| Moroccans | 72.9 /100 | #156 | Good 12.1% |
| Danes | 72.5 /100 | #157 | Good 12.1% |
| Immigrants | Middle Africa | 72.4 /100 | #158 | Good 12.1% |
| Immigrants | Central America | 67.7 /100 | #159 | Good 12.1% |
| Immigrants | Guatemala | 66.0 /100 | #160 | Good 12.1% |
| Guyanese | 64.7 /100 | #161 | Good 12.1% |