Yuman vs Syrian Female Disability
COMPARE
Yuman
Syrian
Female Disability
Female Disability Comparison
Yuman
Syrians
14.5%
FEMALE DISABILITY
0.0/ 100
METRIC RATING
330th/ 347
METRIC RANK
12.1%
FEMALE DISABILITY
76.9/ 100
METRIC RATING
154th/ 347
METRIC RANK
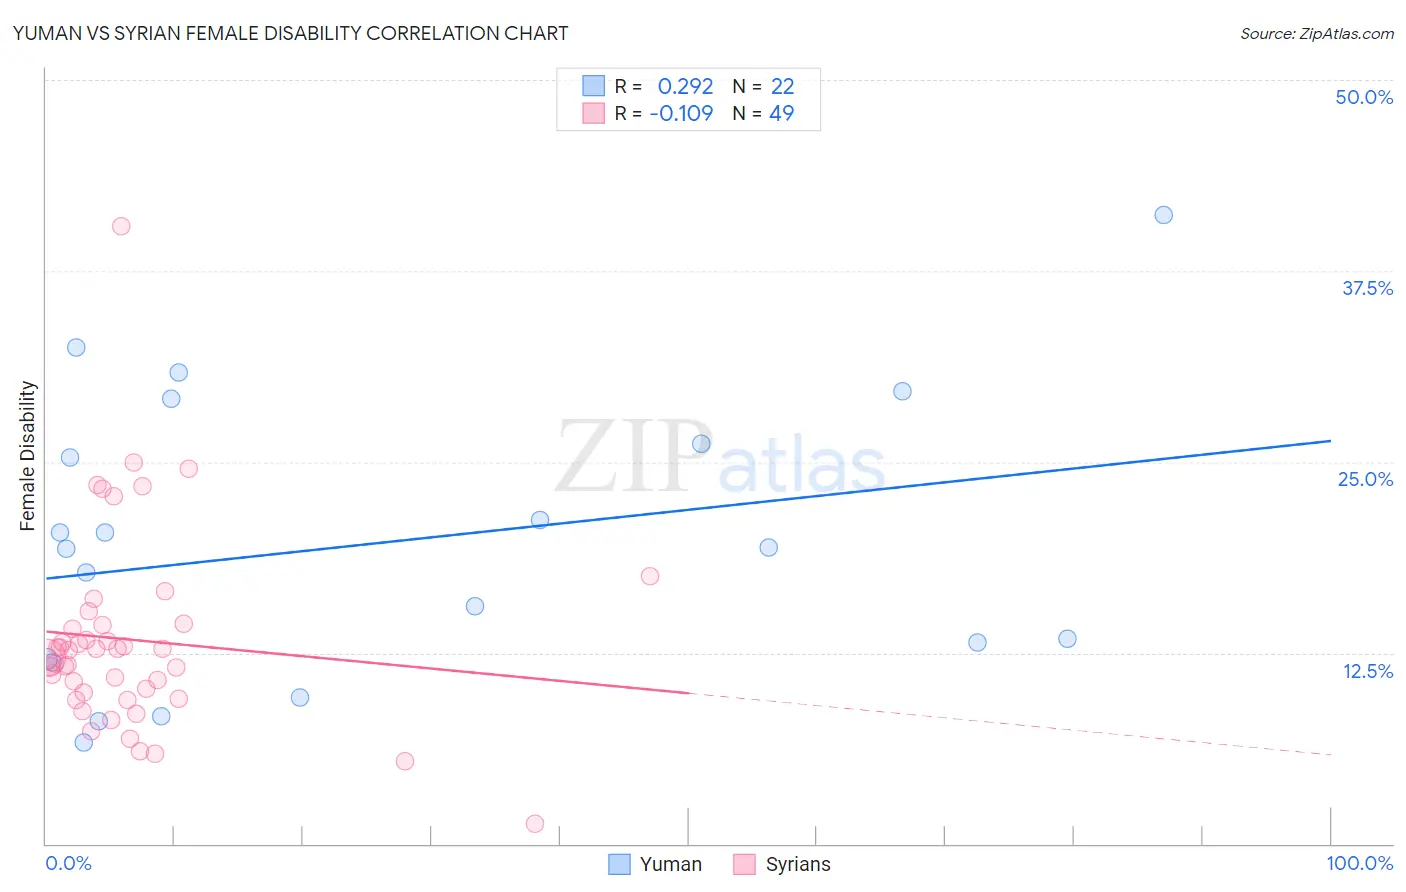
Yuman vs Syrian Female Disability Correlation Chart
The statistical analysis conducted on geographies consisting of 40,663,029 people shows a weak positive correlation between the proportion of Yuman and percentage of females with a disability in the United States with a correlation coefficient (R) of 0.292 and weighted average of 14.5%. Similarly, the statistical analysis conducted on geographies consisting of 266,312,876 people shows a poor negative correlation between the proportion of Syrians and percentage of females with a disability in the United States with a correlation coefficient (R) of -0.109 and weighted average of 12.1%, a difference of 20.2%.
Female Disability Correlation Summary
| Measurement | Yuman | Syrian |
| Minimum | 6.6% | 1.3% |
| Maximum | 41.2% | 40.4% |
| Range | 34.6% | 39.1% |
| Mean | 19.6% | 13.3% |
| Median | 19.4% | 12.7% |
| Interquartile 25% (IQ1) | 12.1% | 9.7% |
| Interquartile 75% (IQ3) | 26.2% | 14.4% |
| Interquartile Range (IQR) | 14.0% | 4.7% |
| Standard Deviation (Sample) | 9.2% | 6.5% |
| Standard Deviation (Population) | 9.0% | 6.4% |
Similar Demographics by Female Disability
Demographics Similar to Yuman by Female Disability
In terms of female disability, the demographic groups most similar to Yuman are Immigrants from Cabo Verde (14.6%, a difference of 0.42%), Osage (14.3%, a difference of 1.4%), Ottawa (14.2%, a difference of 1.8%), Cape Verdean (14.2%, a difference of 1.8%), and Pima (14.8%, a difference of 2.0%).
| Demographics | Rating | Rank | Female Disability |
| Blacks/African Americans | 0.0 /100 | #323 | Tragic 14.1% |
| Natives/Alaskans | 0.0 /100 | #324 | Tragic 14.1% |
| Navajo | 0.0 /100 | #325 | Tragic 14.2% |
| Comanche | 0.0 /100 | #326 | Tragic 14.2% |
| Ottawa | 0.0 /100 | #327 | Tragic 14.2% |
| Cape Verdeans | 0.0 /100 | #328 | Tragic 14.2% |
| Osage | 0.0 /100 | #329 | Tragic 14.3% |
| Yuman | 0.0 /100 | #330 | Tragic 14.5% |
| Immigrants | Cabo Verde | 0.0 /100 | #331 | Tragic 14.6% |
| Pima | 0.0 /100 | #332 | Tragic 14.8% |
| Immigrants | Azores | 0.0 /100 | #333 | Tragic 14.9% |
| Cherokee | 0.0 /100 | #334 | Tragic 14.9% |
| Cajuns | 0.0 /100 | #335 | Tragic 14.9% |
| Seminole | 0.0 /100 | #336 | Tragic 15.0% |
| Tohono O'odham | 0.0 /100 | #337 | Tragic 15.0% |
Demographics Similar to Syrians by Female Disability
In terms of female disability, the demographic groups most similar to Syrians are Ghanaian (12.1%, a difference of 0.020%), Immigrants from Scotland (12.0%, a difference of 0.13%), Sudanese (12.0%, a difference of 0.13%), Moroccan (12.1%, a difference of 0.20%), and Icelander (12.0%, a difference of 0.22%).
| Demographics | Rating | Rank | Female Disability |
| Nigerians | 84.0 /100 | #147 | Excellent 12.0% |
| Immigrants | Kenya | 83.1 /100 | #148 | Excellent 12.0% |
| Greeks | 82.0 /100 | #149 | Excellent 12.0% |
| Immigrants | Moldova | 81.4 /100 | #150 | Excellent 12.0% |
| Icelanders | 80.7 /100 | #151 | Excellent 12.0% |
| Immigrants | Scotland | 79.3 /100 | #152 | Good 12.0% |
| Sudanese | 79.1 /100 | #153 | Good 12.0% |
| Syrians | 76.9 /100 | #154 | Good 12.1% |
| Ghanaians | 76.6 /100 | #155 | Good 12.1% |
| Moroccans | 72.9 /100 | #156 | Good 12.1% |
| Danes | 72.5 /100 | #157 | Good 12.1% |
| Immigrants | Middle Africa | 72.4 /100 | #158 | Good 12.1% |
| Immigrants | Central America | 67.7 /100 | #159 | Good 12.1% |
| Immigrants | Guatemala | 66.0 /100 | #160 | Good 12.1% |
| Guyanese | 64.7 /100 | #161 | Good 12.1% |