Samoan vs Immigrants from Singapore Female Disability

COMPARE

Samoan
Race
Ancestry
AfghanAfricanAlaska NativeAlaskan AthabascanAlbanianAleutAlsatianAmericanApacheArabArapahoArgentineanArmenianAssyrian/Chaldean/SyriacAustralianAustrianBahamianBangladeshiBarbadianBasqueBelgianBelizeanBermudanBhutaneseBlackfeetBolivianBrazilianBritishBritish West IndianBulgarianBurmeseCajunCambodianCanadianCape VerdeanCarpatho RusynCelticCentral AmericanCentral American IndianCherokeeCheyenneChickasawChileanChineseChippewaChoctawColombianColvilleComancheCosta RicanCreeCreekCroatianCrowCubanCypriotCzechCzechoslovakianDanishDelawareDominicanDutchDutch West IndianEastern EuropeanEcuadorianEgyptianEnglishEstonianEthiopianEuropeanFijianFilipinoFinnishFrenchFrench American IndianFrench CanadianGermanGerman RussianGhanaianGreekGuamanian/ChamorroGuatemalanGuyaneseHaitianHmongHonduranHopiHoumaHungarianIcelanderIndian (Asian)IndonesianInupiatIranianIraqiIrishIroquoisIsraeliItalianJamaicanJapaneseJordanianKenyanKiowaKoreanLaotianLatvianLebaneseLiberianLithuanianLumbeeLuxembourgerMacedonianMalaysianMalteseMarshalleseMenomineeMexicanMexican American IndianMongolianMoroccanNative HawaiianNavajoNepaleseNew ZealanderNicaraguanNigerianNorthern EuropeanNorwegianOkinawanOsageOttawaPaiutePakistaniPalestinianPanamanianParaguayanPennsylvania GermanPeruvianPimaPolishPortuguesePotawatomiPuebloPuerto RicanPuget Sound SalishRomanianRussianSalvadoranSamoanScandinavianScotch-IrishScottishSeminoleSenegaleseSerbianShoshoneSierra LeoneanSiouxSlavicSlovakSloveneSomaliSouth AfricanSouth AmericanSouth American IndianSoviet UnionSpaniardSpanishSpanish AmericanSpanish American IndianSri LankanSubsaharan AfricanSudaneseSwedishSwissSyrianTaiwaneseThaiTlingit-HaidaTohono O'OdhamTonganTrinidadian and TobagonianTsimshianTurkishU.S. Virgin IslanderUgandanUkrainianUruguayanUteVenezuelanVietnameseWelshWest IndianYakamaYaquiYugoslavianYumanYup'ikZimbabwean
Immigration
NonimmigrantsImmigrantsAfghanistanAfricaAlbaniaArgentinaArmeniaAsiaAustraliaAustriaBahamasBangladeshBarbadosBelarusBelgiumBelizeBoliviaBosnia and HerzegovinaBrazilBulgariaBurma/MyanmarCabo VerdeCambodiaCameroonCanadaCaribbeanCentral AmericaChileChinaColombiaCongoCosta RicaCroatiaCubaCzechoslovakiaDenmarkDominicaDominican RepublicEastern AfricaEastern AsiaEastern EuropeEcuadorEgyptEl SalvadorEnglandEritreaEthiopiaEuropeFijiFranceGermanyGhanaGreeceGrenadaGuatemalaGuyanaHaitiHondurasHong KongHungaryIndiaIndonesiaIranIraqIrelandIsraelItalyJamaicaJapanJordanKazakhstanKenyaKoreaKuwaitLaosLatin AmericaLatviaLebanonLiberiaLithuaniaMalaysiaMexicoMicronesiaMiddle AfricaMoldovaMoroccoNepalNetherlandsNicaraguaNigeriaNorth AmericaNorth MacedoniaNorthern AfricaNorthern EuropeNorwayOceaniaPakistanPanamaPeruPhilippinesPolandPortugalRomaniaRussiaSaudi ArabiaScotlandSenegalSerbiaSierra LeoneSomaliaSouth AfricaSouth AmericaSouth Central AsiaSouth Eastern AsiaSouthern EuropeSpainSri LankaSt. Vincent and the GrenadinesSudanSwedenSwitzerlandSyriaTaiwanThailandTrinidad and TobagoTurkeyUgandaUkraineUruguayUzbekistanVenezuelaVietnamWest IndiesWestern AfricaWestern AsiaWestern EuropeYemenZaireZimbabweAzores
Immigrants from Singapore
Race
Ancestry
AfghanAfricanAlaska NativeAlaskan AthabascanAlbanianAleutAlsatianAmericanApacheArabArapahoArgentineanArmenianAssyrian/Chaldean/SyriacAustralianAustrianBahamianBangladeshiBarbadianBasqueBelgianBelizeanBermudanBhutaneseBlackfeetBolivianBrazilianBritishBritish West IndianBulgarianBurmeseCajunCambodianCanadianCape VerdeanCarpatho RusynCelticCentral AmericanCentral American IndianCherokeeCheyenneChickasawChileanChineseChippewaChoctawColombianColvilleComancheCosta RicanCreeCreekCroatianCrowCubanCypriotCzechCzechoslovakianDanishDelawareDominicanDutchDutch West IndianEastern EuropeanEcuadorianEgyptianEnglishEstonianEthiopianEuropeanFijianFilipinoFinnishFrenchFrench American IndianFrench CanadianGermanGerman RussianGhanaianGreekGuamanian/ChamorroGuatemalanGuyaneseHaitianHmongHonduranHopiHoumaHungarianIcelanderIndian (Asian)IndonesianInupiatIranianIraqiIrishIroquoisIsraeliItalianJamaicanJapaneseJordanianKenyanKiowaKoreanLaotianLatvianLebaneseLiberianLithuanianLumbeeLuxembourgerMacedonianMalaysianMalteseMarshalleseMenomineeMexicanMexican American IndianMongolianMoroccanNative HawaiianNavajoNepaleseNew ZealanderNicaraguanNigerianNorthern EuropeanNorwegianOkinawanOsageOttawaPaiutePakistaniPalestinianPanamanianParaguayanPennsylvania GermanPeruvianPimaPolishPortuguesePotawatomiPuebloPuerto RicanPuget Sound SalishRomanianRussianSalvadoranScandinavianScotch-IrishScottishSeminoleSenegaleseSerbianShoshoneSierra LeoneanSiouxSlavicSlovakSloveneSomaliSouth AfricanSouth AmericanSouth American IndianSoviet UnionSpaniardSpanishSpanish AmericanSpanish American IndianSri LankanSubsaharan AfricanSudaneseSwedishSwissSyrianTaiwaneseThaiTlingit-HaidaTohono O'OdhamTonganTrinidadian and TobagonianTsimshianTurkishU.S. Virgin IslanderUgandanUkrainianUruguayanUteVenezuelanVietnameseWelshWest IndianYakamaYaquiYugoslavianYumanYup'ikZimbabwean
Immigration
NonimmigrantsImmigrantsAfghanistanAfricaAlbaniaArgentinaArmeniaAsiaAustraliaAustriaBahamasBangladeshBarbadosBelarusBelgiumBelizeBoliviaBosnia and HerzegovinaBrazilBulgariaBurma/MyanmarCabo VerdeCambodiaCameroonCanadaCaribbeanCentral AmericaChileChinaColombiaCongoCosta RicaCroatiaCubaCzechoslovakiaDenmarkDominicaDominican RepublicEastern AfricaEastern AsiaEastern EuropeEcuadorEgyptEl SalvadorEnglandEritreaEthiopiaEuropeFijiFranceGermanyGhanaGreeceGrenadaGuatemalaGuyanaHaitiHondurasHong KongHungaryIndiaIndonesiaIranIraqIrelandIsraelItalyJamaicaJapanJordanKazakhstanKenyaKoreaKuwaitLaosLatin AmericaLatviaLebanonLiberiaLithuaniaMalaysiaMexicoMicronesiaMiddle AfricaMoldovaMoroccoNepalNetherlandsNicaraguaNigeriaNorth AmericaNorth MacedoniaNorthern AfricaNorthern EuropeNorwayOceaniaPakistanPanamaPeruPhilippinesPolandPortugalRomaniaRussiaSaudi ArabiaScotlandSenegalSerbiaSierra LeoneSingaporeSomaliaSouth AfricaSouth AmericaSouth Central AsiaSouth Eastern AsiaSouthern EuropeSpainSri LankaSt. Vincent and the GrenadinesSudanSwedenSwitzerlandSyriaTaiwanThailandTrinidad and TobagoTurkeyUgandaUkraineUruguayUzbekistanVenezuelaVietnamWest IndiesWestern AfricaWestern AsiaWestern EuropeYemenZaireZimbabweAzores
Female Disability
Income
Poverty
Unemployment
Labor Participation
Family Structure
Vehicle Availability
Education Level
Disability

Female Disability Comparison

Samoans

Immigrants from Singapore

Poor
Exceptional
12.4%
FEMALE DISABILITY
13.4/ 100
METRIC RATING
215th/ 347
METRIC RANK
10.4%
FEMALE DISABILITY
100.0/ 100
METRIC RATING
7th/ 347
METRIC RANK

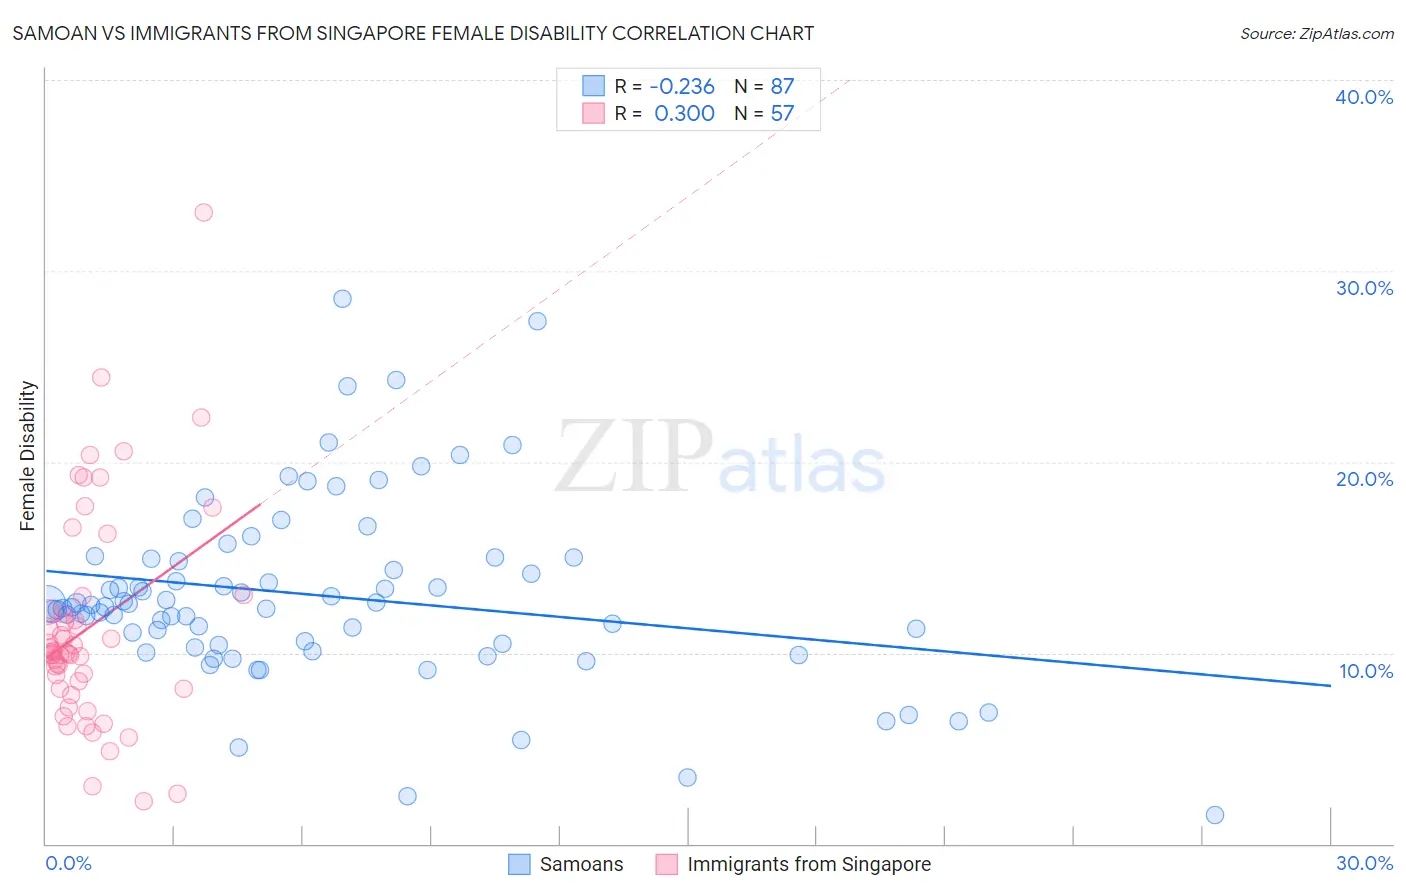
Samoan vs Immigrants from Singapore Female Disability Correlation Chart

The statistical analysis conducted on geographies consisting of 225,122,232 people shows a weak negative correlation between the proportion of Samoans and percentage of females with a disability in the United States with a correlation coefficient (R) of -0.236 and weighted average of 12.4%. Similarly, the statistical analysis conducted on geographies consisting of 137,521,534 people shows a weak positive correlation between the proportion of Immigrants from Singapore and percentage of females with a disability in the United States with a correlation coefficient (R) of 0.300 and weighted average of 10.4%, a difference of 18.9%.
Samoan vs Immigrants from Singapore Female Disability

Female Disability Correlation Summary

MeasurementSamoanImmigrants from Singapore
Minimum1.5%2.2%
Maximum28.6%33.0%
Range27.1%30.8%
Mean13.0%11.4%
Median12.4%10.0%
Interquartile 25% (IQ1)10.4%8.1%
Interquartile 75% (IQ3)14.9%12.6%
Interquartile Range (IQR)4.5%4.4%
Standard Deviation (Sample)4.8%5.7%
Standard Deviation (Population)4.8%5.6%

Similar Demographics by Female Disability

Demographics Similar to Samoans by Female Disability

In terms of female disability, the demographic groups most similar to Samoans are Panamanian (12.4%, a difference of 0.0%), Immigrants from Burma/Myanmar (12.4%, a difference of 0.010%), British (12.4%, a difference of 0.060%), Immigrants from Thailand (12.4%, a difference of 0.080%), and Immigrants from Bahamas (12.4%, a difference of 0.080%).
DemographicsRating | RankFemale Disability
Basques
17.5
/100
|
#208
Poor
12.4%
Mexicans
15.7
/100
|
#209
Poor
12.4%
Swiss
14.9
/100
|
#210
Poor
12.4%
Immigrants | Bosnia and Herzegovina
14.8
/100
|
#211
Poor
12.4%
Ute
14.7
/100
|
#212
Poor
12.4%
Immigrants | Thailand
14.5
/100
|
#213
Poor
12.4%
Panamanians
13.5
/100
|
#214
Poor
12.4%
Samoans
13.4
/100
|
#215
Poor
12.4%
Immigrants | Burma/Myanmar
13.3
/100
|
#216
Poor
12.4%
British
12.7
/100
|
#217
Poor
12.4%
Immigrants | Bahamas
12.5
/100
|
#218
Poor
12.4%
Europeans
12.1
/100
|
#219
Poor
12.4%
Bahamians
11.1
/100
|
#220
Poor
12.4%
Native Hawaiians
10.8
/100
|
#221
Poor
12.4%
Italians
10.7
/100
|
#222
Poor
12.4%

Demographics Similar to Immigrants from Singapore by Female Disability

In terms of female disability, the demographic groups most similar to Immigrants from Singapore are Immigrants from South Central Asia (10.5%, a difference of 0.22%), Bolivian (10.4%, a difference of 0.78%), Iranian (10.6%, a difference of 1.1%), Immigrants from Bolivia (10.3%, a difference of 1.7%), and Immigrants from Hong Kong (10.6%, a difference of 1.8%).
DemographicsRating | RankFemale Disability
Immigrants | India
100.0
/100
|
#1
Exceptional
10.0%
Filipinos
100.0
/100
|
#2
Exceptional
10.1%
Immigrants | Taiwan
100.0
/100
|
#3
Exceptional
10.1%
Thais
100.0
/100
|
#4
Exceptional
10.2%
Immigrants | Bolivia
100.0
/100
|
#5
Exceptional
10.3%
Bolivians
100.0
/100
|
#6
Exceptional
10.4%
Immigrants | Singapore
100.0
/100
|
#7
Exceptional
10.4%
Immigrants | South Central Asia
100.0
/100
|
#8
Exceptional
10.5%
Iranians
100.0
/100
|
#9
Exceptional
10.6%
Immigrants | Hong Kong
100.0
/100
|
#10
Exceptional
10.6%
Immigrants | Korea
100.0
/100
|
#11
Exceptional
10.6%
Immigrants | Israel
100.0
/100
|
#12
Exceptional
10.7%
Immigrants | Eastern Asia
100.0
/100
|
#13
Exceptional
10.7%
Immigrants | China
100.0
/100
|
#14
Exceptional
10.7%
Burmese
100.0
/100
|
#15
Exceptional
10.7%