Immigrants from Cameroon vs Immigrants from Somalia Disability Age Under 5

COMPARE

Immigrants from Cameroon
Race
Ancestry
AfghanAfricanAlaska NativeAlaskan AthabascanAlbanianAleutAlsatianAmericanApacheArabArapahoArgentineanArmenianAssyrian/Chaldean/SyriacAustralianAustrianBahamianBangladeshiBarbadianBasqueBelgianBelizeanBermudanBhutaneseBlackfeetBolivianBrazilianBritishBritish West IndianBulgarianBurmeseCajunCambodianCanadianCape VerdeanCarpatho RusynCelticCentral AmericanCentral American IndianCherokeeCheyenneChickasawChileanChineseChippewaChoctawColombianColvilleComancheCosta RicanCreeCreekCroatianCrowCubanCypriotCzechCzechoslovakianDanishDelawareDominicanDutchDutch West IndianEastern EuropeanEcuadorianEgyptianEnglishEstonianEthiopianEuropeanFijianFilipinoFinnishFrenchFrench American IndianFrench CanadianGermanGerman RussianGhanaianGreekGuamanian/ChamorroGuatemalanGuyaneseHaitianHmongHonduranHopiHoumaHungarianIcelanderIndian (Asian)IndonesianInupiatIranianIraqiIrishIroquoisIsraeliItalianJamaicanJapaneseJordanianKenyanKiowaKoreanLaotianLatvianLebaneseLiberianLithuanianLumbeeLuxembourgerMacedonianMalaysianMalteseMarshalleseMenomineeMexicanMexican American IndianMongolianMoroccanNative HawaiianNavajoNepaleseNew ZealanderNicaraguanNigerianNorthern EuropeanNorwegianOkinawanOsageOttawaPaiutePakistaniPalestinianPanamanianParaguayanPennsylvania GermanPeruvianPimaPolishPortuguesePotawatomiPuebloPuerto RicanPuget Sound SalishRomanianRussianSalvadoranSamoanScandinavianScotch-IrishScottishSeminoleSenegaleseSerbianShoshoneSierra LeoneanSiouxSlavicSlovakSloveneSomaliSouth AfricanSouth AmericanSouth American IndianSoviet UnionSpaniardSpanishSpanish AmericanSpanish American IndianSri LankanSubsaharan AfricanSudaneseSwedishSwissSyrianTaiwaneseThaiTlingit-HaidaTohono O'OdhamTonganTrinidadian and TobagonianTsimshianTurkishU.S. Virgin IslanderUgandanUkrainianUruguayanUteVenezuelanVietnameseWelshWest IndianYakamaYaquiYugoslavianYumanYup'ikZimbabwean
Immigration
NonimmigrantsImmigrantsAfghanistanAfricaAlbaniaArgentinaArmeniaAsiaAustraliaAustriaBahamasBangladeshBarbadosBelarusBelgiumBelizeBoliviaBosnia and HerzegovinaBrazilBulgariaBurma/MyanmarCabo VerdeCambodiaCameroonCanadaCaribbeanCentral AmericaChileChinaColombiaCongoCosta RicaCroatiaCubaCzechoslovakiaDenmarkDominicaDominican RepublicEastern AfricaEastern AsiaEastern EuropeEcuadorEgyptEl SalvadorEnglandEritreaEthiopiaEuropeFijiFranceGermanyGhanaGreeceGrenadaGuatemalaGuyanaHaitiHondurasHong KongHungaryIndiaIndonesiaIranIraqIrelandIsraelItalyJamaicaJapanJordanKazakhstanKenyaKoreaKuwaitLaosLatin AmericaLatviaLebanonLiberiaLithuaniaMalaysiaMexicoMicronesiaMiddle AfricaMoldovaMoroccoNepalNetherlandsNicaraguaNigeriaNorth AmericaNorth MacedoniaNorthern AfricaNorthern EuropeNorwayOceaniaPakistanPanamaPeruPhilippinesPolandPortugalRomaniaRussiaSaudi ArabiaScotlandSenegalSerbiaSierra LeoneSingaporeSouth AfricaSouth AmericaSouth Central AsiaSouth Eastern AsiaSouthern EuropeSpainSri LankaSt. Vincent and the GrenadinesSudanSwedenSwitzerlandSyriaTaiwanThailandTrinidad and TobagoTurkeyUgandaUkraineUruguayUzbekistanVenezuelaVietnamWest IndiesWestern AfricaWestern AsiaWestern EuropeYemenZaireZimbabweAzores
Immigrants from Somalia
Race
Ancestry
AfghanAfricanAlaska NativeAlaskan AthabascanAlbanianAleutAlsatianAmericanApacheArabArapahoArgentineanArmenianAssyrian/Chaldean/SyriacAustralianAustrianBahamianBangladeshiBarbadianBasqueBelgianBelizeanBermudanBhutaneseBlackfeetBolivianBrazilianBritishBritish West IndianBulgarianBurmeseCajunCambodianCanadianCape VerdeanCarpatho RusynCelticCentral AmericanCentral American IndianCherokeeCheyenneChickasawChileanChineseChippewaChoctawColombianColvilleComancheCosta RicanCreeCreekCroatianCrowCubanCypriotCzechCzechoslovakianDanishDelawareDominicanDutchDutch West IndianEastern EuropeanEcuadorianEgyptianEnglishEstonianEthiopianEuropeanFijianFilipinoFinnishFrenchFrench American IndianFrench CanadianGermanGerman RussianGhanaianGreekGuamanian/ChamorroGuatemalanGuyaneseHaitianHmongHonduranHopiHoumaHungarianIcelanderIndian (Asian)IndonesianInupiatIranianIraqiIrishIroquoisIsraeliItalianJamaicanJapaneseJordanianKenyanKiowaKoreanLaotianLatvianLebaneseLiberianLithuanianLumbeeLuxembourgerMacedonianMalaysianMalteseMarshalleseMenomineeMexicanMexican American IndianMongolianMoroccanNative HawaiianNavajoNepaleseNew ZealanderNicaraguanNigerianNorthern EuropeanNorwegianOkinawanOsageOttawaPaiutePakistaniPalestinianPanamanianParaguayanPennsylvania GermanPeruvianPimaPolishPortuguesePotawatomiPuebloPuerto RicanPuget Sound SalishRomanianRussianSalvadoranSamoanScandinavianScotch-IrishScottishSeminoleSenegaleseSerbianShoshoneSierra LeoneanSiouxSlavicSlovakSloveneSomaliSouth AfricanSouth AmericanSouth American IndianSoviet UnionSpaniardSpanishSpanish AmericanSpanish American IndianSri LankanSubsaharan AfricanSudaneseSwedishSwissSyrianTaiwaneseThaiTlingit-HaidaTohono O'OdhamTonganTrinidadian and TobagonianTsimshianTurkishU.S. Virgin IslanderUgandanUkrainianUruguayanUteVenezuelanVietnameseWelshWest IndianYakamaYaquiYugoslavianYumanYup'ikZimbabwean
Immigration
NonimmigrantsImmigrantsAfghanistanAfricaAlbaniaArgentinaArmeniaAsiaAustraliaAustriaBahamasBangladeshBarbadosBelarusBelgiumBelizeBoliviaBosnia and HerzegovinaBrazilBulgariaBurma/MyanmarCabo VerdeCambodiaCanadaCaribbeanCentral AmericaChileChinaColombiaCongoCosta RicaCroatiaCubaCzechoslovakiaDenmarkDominicaDominican RepublicEastern AfricaEastern AsiaEastern EuropeEcuadorEgyptEl SalvadorEnglandEritreaEthiopiaEuropeFijiFranceGermanyGhanaGreeceGrenadaGuatemalaGuyanaHaitiHondurasHong KongHungaryIndiaIndonesiaIranIraqIrelandIsraelItalyJamaicaJapanJordanKazakhstanKenyaKoreaKuwaitLaosLatin AmericaLatviaLebanonLiberiaLithuaniaMalaysiaMexicoMicronesiaMiddle AfricaMoldovaMoroccoNepalNetherlandsNicaraguaNigeriaNorth AmericaNorth MacedoniaNorthern AfricaNorthern EuropeNorwayOceaniaPakistanPanamaPeruPhilippinesPolandPortugalRomaniaRussiaSaudi ArabiaScotlandSenegalSerbiaSierra LeoneSingaporeSomaliaSouth AfricaSouth AmericaSouth Central AsiaSouth Eastern AsiaSouthern EuropeSpainSri LankaSt. Vincent and the GrenadinesSudanSwedenSwitzerlandSyriaTaiwanThailandTrinidad and TobagoTurkeyUgandaUkraineUruguayUzbekistanVenezuelaVietnamWest IndiesWestern AfricaWestern AsiaWestern EuropeYemenZaireZimbabweAzores
Disability Age Under 5
Income
Poverty
Unemployment
Labor Participation
Family Structure
Vehicle Availability
Education Level
Disability

Disability Age Under 5 Comparison

Immigrants from Cameroon

Immigrants from Somalia

Tragic
Fair
1.4%
DISABILITY AGE UNDER 5
1.7/ 100
METRIC RATING
243rd/ 347
METRIC RANK
1.3%
DISABILITY AGE UNDER 5
31.3/ 100
METRIC RATING
197th/ 347
METRIC RANK

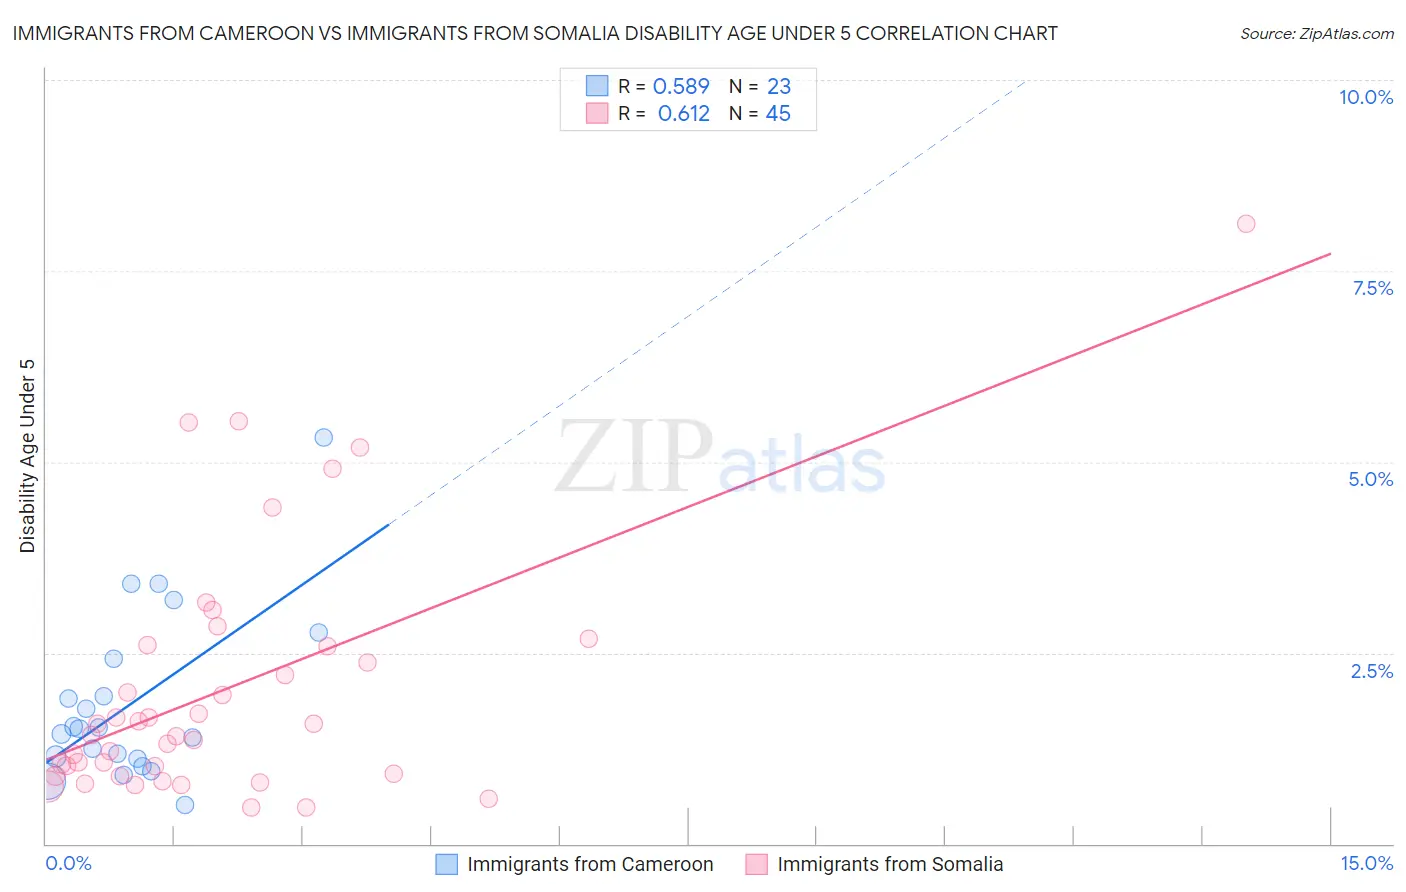
Immigrants from Cameroon vs Immigrants from Somalia Disability Age Under 5 Correlation Chart

The statistical analysis conducted on geographies consisting of 95,639,339 people shows a substantial positive correlation between the proportion of Immigrants from Cameroon and percentage of population with a disability under the age of 5 in the United States with a correlation coefficient (R) of 0.589 and weighted average of 1.4%. Similarly, the statistical analysis conducted on geographies consisting of 75,075,754 people shows a significant positive correlation between the proportion of Immigrants from Somalia and percentage of population with a disability under the age of 5 in the United States with a correlation coefficient (R) of 0.612 and weighted average of 1.3%, a difference of 7.2%.
Immigrants from Cameroon vs Immigrants from Somalia Disability Age Under 5

Disability Age Under 5 Correlation Summary

MeasurementImmigrants from CameroonImmigrants from Somalia
Minimum0.51%0.47%
Maximum5.3%8.1%
Range4.8%7.7%
Mean1.8%2.0%
Median1.5%1.4%
Interquartile 25% (IQ1)1.1%0.90%
Interquartile 75% (IQ3)2.4%2.6%
Interquartile Range (IQR)1.3%1.7%
Standard Deviation (Sample)1.1%1.6%
Standard Deviation (Population)1.1%1.6%

Similar Demographics by Disability Age Under 5

Demographics Similar to Immigrants from Cameroon by Disability Age Under 5

In terms of disability age under 5, the demographic groups most similar to Immigrants from Cameroon are Lumbee (1.3%, a difference of 0.38%), Spaniard (1.4%, a difference of 0.43%), Maltese (1.3%, a difference of 0.46%), Native Hawaiian (1.3%, a difference of 0.53%), and Immigrants from Austria (1.3%, a difference of 0.56%).
DemographicsRating | RankDisability Age Under 5
South American Indians
3.3
/100
|
#236
Tragic
1.3%
Basques
3.0
/100
|
#237
Tragic
1.3%
Spanish American Indians
2.4
/100
|
#238
Tragic
1.3%
Immigrants | Austria
2.3
/100
|
#239
Tragic
1.3%
Native Hawaiians
2.2
/100
|
#240
Tragic
1.3%
Maltese
2.2
/100
|
#241
Tragic
1.3%
Lumbee
2.1
/100
|
#242
Tragic
1.3%
Immigrants | Cameroon
1.7
/100
|
#243
Tragic
1.4%
Spaniards
1.4
/100
|
#244
Tragic
1.4%
Potawatomi
1.1
/100
|
#245
Tragic
1.4%
Russians
1.0
/100
|
#246
Tragic
1.4%
Immigrants | England
1.0
/100
|
#247
Tragic
1.4%
Eastern Europeans
1.0
/100
|
#248
Tragic
1.4%
Bermudans
1.0
/100
|
#249
Tragic
1.4%
Africans
1.0
/100
|
#250
Tragic
1.4%

Demographics Similar to Immigrants from Somalia by Disability Age Under 5

In terms of disability age under 5, the demographic groups most similar to Immigrants from Somalia are Immigrants from Belgium (1.3%, a difference of 0.010%), Immigrants from Norway (1.3%, a difference of 0.030%), Jamaican (1.3%, a difference of 0.070%), U.S. Virgin Islander (1.3%, a difference of 0.31%), and Immigrants from North Macedonia (1.3%, a difference of 0.34%).
DemographicsRating | RankDisability Age Under 5
Immigrants | Laos
36.6
/100
|
#190
Fair
1.3%
Mexican American Indians
36.6
/100
|
#191
Fair
1.3%
Immigrants | Bosnia and Herzegovina
36.5
/100
|
#192
Fair
1.3%
Immigrants | Sierra Leone
36.5
/100
|
#193
Fair
1.3%
Immigrants | North Macedonia
34.7
/100
|
#194
Fair
1.3%
U.S. Virgin Islanders
34.4
/100
|
#195
Fair
1.3%
Immigrants | Belgium
31.4
/100
|
#196
Fair
1.3%
Immigrants | Somalia
31.3
/100
|
#197
Fair
1.3%
Immigrants | Norway
31.1
/100
|
#198
Fair
1.3%
Jamaicans
30.7
/100
|
#199
Fair
1.3%
Immigrants | Lithuania
27.2
/100
|
#200
Fair
1.3%
Immigrants | Italy
25.4
/100
|
#201
Fair
1.3%
Arapaho
24.1
/100
|
#202
Fair
1.3%
Liberians
24.0
/100
|
#203
Fair
1.3%
Immigrants | Europe
23.6
/100
|
#204
Fair
1.3%