Immigrants from Cameroon vs Hispanic or Latino Disability Age Under 5
COMPARE
Immigrants from Cameroon
Hispanic or Latino
Disability Age Under 5
Disability Age Under 5 Comparison
Immigrants from Cameroon
Hispanics or Latinos
1.4%
DISABILITY AGE UNDER 5
1.7/ 100
METRIC RATING
243rd/ 347
METRIC RANK
1.3%
DISABILITY AGE UNDER 5
7.7/ 100
METRIC RATING
223rd/ 347
METRIC RANK
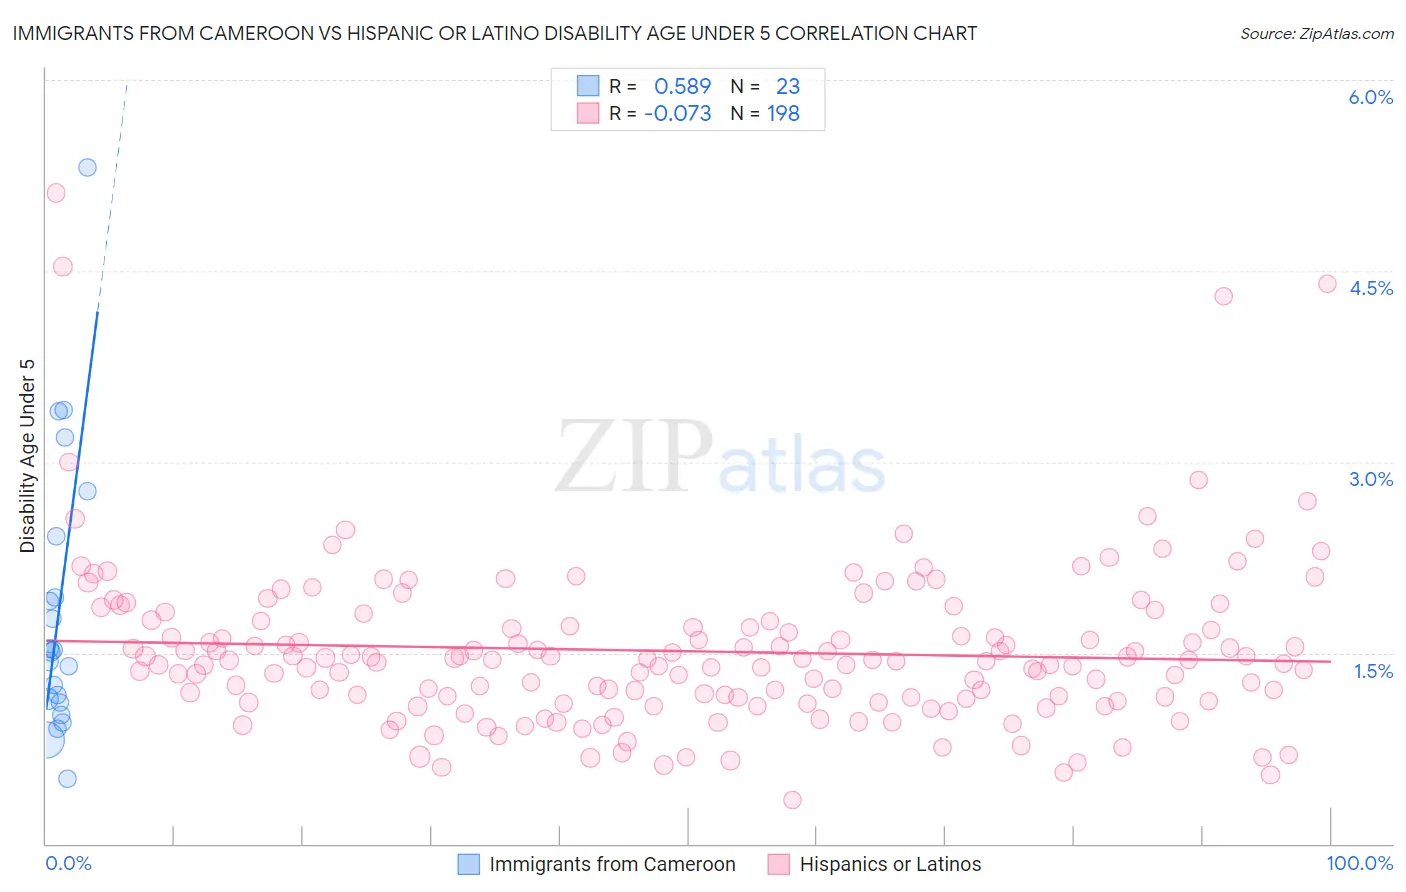
Immigrants from Cameroon vs Hispanic or Latino Disability Age Under 5 Correlation Chart
The statistical analysis conducted on geographies consisting of 95,639,339 people shows a substantial positive correlation between the proportion of Immigrants from Cameroon and percentage of population with a disability under the age of 5 in the United States with a correlation coefficient (R) of 0.589 and weighted average of 1.4%. Similarly, the statistical analysis conducted on geographies consisting of 261,565,458 people shows a slight negative correlation between the proportion of Hispanics or Latinos and percentage of population with a disability under the age of 5 in the United States with a correlation coefficient (R) of -0.073 and weighted average of 1.3%, a difference of 3.3%.
Disability Age Under 5 Correlation Summary
| Measurement | Immigrants from Cameroon | Hispanic or Latino |
| Minimum | 0.51% | 0.35% |
| Maximum | 5.3% | 5.1% |
| Range | 4.8% | 4.8% |
| Mean | 1.8% | 1.5% |
| Median | 1.5% | 1.4% |
| Interquartile 25% (IQ1) | 1.1% | 1.1% |
| Interquartile 75% (IQ3) | 2.4% | 1.7% |
| Interquartile Range (IQR) | 1.3% | 0.61% |
| Standard Deviation (Sample) | 1.1% | 0.65% |
| Standard Deviation (Population) | 1.1% | 0.65% |
Demographics Similar to Immigrants from Cameroon and Hispanics or Latinos by Disability Age Under 5
In terms of disability age under 5, the demographic groups most similar to Immigrants from Cameroon are Lumbee (1.3%, a difference of 0.38%), Maltese (1.3%, a difference of 0.46%), Native Hawaiian (1.3%, a difference of 0.53%), Immigrants from Austria (1.3%, a difference of 0.56%), and Spanish American Indian (1.3%, a difference of 0.72%). Similarly, the demographic groups most similar to Hispanics or Latinos are Latvian (1.3%, a difference of 0.16%), Panamanian (1.3%, a difference of 0.19%), Bahamian (1.3%, a difference of 0.19%), Taiwanese (1.3%, a difference of 0.53%), and Luxembourger (1.3%, a difference of 0.54%).
| Demographics | Rating | Rank | Disability Age Under 5 |
| Hispanics or Latinos | 7.7 /100 | #223 | Tragic 1.3% |
| Latvians | 7.1 /100 | #224 | Tragic 1.3% |
| Panamanians | 7.1 /100 | #225 | Tragic 1.3% |
| Bahamians | 7.1 /100 | #226 | Tragic 1.3% |
| Taiwanese | 6.1 /100 | #227 | Tragic 1.3% |
| Luxembourgers | 6.1 /100 | #228 | Tragic 1.3% |
| Immigrants | Costa Rica | 5.5 /100 | #229 | Tragic 1.3% |
| Lebanese | 5.3 /100 | #230 | Tragic 1.3% |
| Immigrants | Northern Europe | 4.7 /100 | #231 | Tragic 1.3% |
| French American Indians | 4.5 /100 | #232 | Tragic 1.3% |
| Tongans | 4.2 /100 | #233 | Tragic 1.3% |
| Pueblo | 3.8 /100 | #234 | Tragic 1.3% |
| Central American Indians | 3.6 /100 | #235 | Tragic 1.3% |
| South American Indians | 3.3 /100 | #236 | Tragic 1.3% |
| Basques | 3.0 /100 | #237 | Tragic 1.3% |
| Spanish American Indians | 2.4 /100 | #238 | Tragic 1.3% |
| Immigrants | Austria | 2.3 /100 | #239 | Tragic 1.3% |
| Native Hawaiians | 2.2 /100 | #240 | Tragic 1.3% |
| Maltese | 2.2 /100 | #241 | Tragic 1.3% |
| Lumbee | 2.1 /100 | #242 | Tragic 1.3% |
| Immigrants | Cameroon | 1.7 /100 | #243 | Tragic 1.4% |