Haitian vs Immigrants from Vietnam Disability Age Under 5

COMPARE

Haitian
Race
Ancestry
AfghanAfricanAlaska NativeAlaskan AthabascanAlbanianAleutAlsatianAmericanApacheArabArapahoArgentineanArmenianAssyrian/Chaldean/SyriacAustralianAustrianBahamianBangladeshiBarbadianBasqueBelgianBelizeanBermudanBhutaneseBlackfeetBolivianBrazilianBritishBritish West IndianBulgarianBurmeseCajunCambodianCanadianCape VerdeanCarpatho RusynCelticCentral AmericanCentral American IndianCherokeeCheyenneChickasawChileanChineseChippewaChoctawColombianColvilleComancheCosta RicanCreeCreekCroatianCrowCubanCypriotCzechCzechoslovakianDanishDelawareDominicanDutchDutch West IndianEastern EuropeanEcuadorianEgyptianEnglishEstonianEthiopianEuropeanFijianFilipinoFinnishFrenchFrench American IndianFrench CanadianGermanGerman RussianGhanaianGreekGuamanian/ChamorroGuatemalanGuyaneseHaitianHmongHonduranHopiHoumaHungarianIcelanderIndian (Asian)IndonesianInupiatIranianIraqiIrishIroquoisIsraeliItalianJamaicanJapaneseJordanianKenyanKiowaKoreanLaotianLatvianLebaneseLiberianLithuanianLumbeeLuxembourgerMacedonianMalaysianMalteseMarshalleseMenomineeMexicanMexican American IndianMongolianMoroccanNative HawaiianNavajoNepaleseNew ZealanderNicaraguanNigerianNorthern EuropeanNorwegianOkinawanOsageOttawaPaiutePakistaniPalestinianPanamanianParaguayanPennsylvania GermanPeruvianPimaPolishPortuguesePotawatomiPuebloPuerto RicanPuget Sound SalishRomanianRussianSalvadoranSamoanScandinavianScotch-IrishScottishSeminoleSenegaleseSerbianShoshoneSierra LeoneanSiouxSlavicSlovakSloveneSomaliSouth AfricanSouth AmericanSouth American IndianSoviet UnionSpaniardSpanishSpanish AmericanSpanish American IndianSri LankanSubsaharan AfricanSudaneseSwedishSwissSyrianTaiwaneseThaiTlingit-HaidaTohono O'OdhamTonganTrinidadian and TobagonianTsimshianTurkishU.S. Virgin IslanderUgandanUkrainianUruguayanUteVenezuelanVietnameseWelshWest IndianYakamaYaquiYugoslavianYumanYup'ikZimbabwean
Immigration
NonimmigrantsImmigrantsAfghanistanAfricaAlbaniaArgentinaArmeniaAsiaAustraliaAustriaBahamasBangladeshBarbadosBelarusBelgiumBelizeBoliviaBosnia and HerzegovinaBrazilBulgariaBurma/MyanmarCabo VerdeCambodiaCameroonCanadaCaribbeanCentral AmericaChileChinaColombiaCongoCosta RicaCroatiaCubaCzechoslovakiaDenmarkDominicaDominican RepublicEastern AfricaEastern AsiaEastern EuropeEcuadorEgyptEl SalvadorEnglandEritreaEthiopiaEuropeFijiFranceGermanyGhanaGreeceGrenadaGuatemalaGuyanaHaitiHondurasHong KongHungaryIndiaIndonesiaIranIraqIrelandIsraelItalyJamaicaJapanJordanKazakhstanKenyaKoreaKuwaitLaosLatin AmericaLatviaLebanonLiberiaLithuaniaMalaysiaMexicoMicronesiaMiddle AfricaMoldovaMoroccoNepalNetherlandsNicaraguaNigeriaNorth AmericaNorth MacedoniaNorthern AfricaNorthern EuropeNorwayOceaniaPakistanPanamaPeruPhilippinesPolandPortugalRomaniaRussiaSaudi ArabiaScotlandSenegalSerbiaSierra LeoneSingaporeSomaliaSouth AfricaSouth AmericaSouth Central AsiaSouth Eastern AsiaSouthern EuropeSpainSri LankaSt. Vincent and the GrenadinesSudanSwedenSwitzerlandSyriaTaiwanThailandTrinidad and TobagoTurkeyUgandaUkraineUruguayUzbekistanVenezuelaWest IndiesWestern AfricaWestern AsiaWestern EuropeYemenZaireZimbabweAzores
Immigrants from Vietnam
Race
Ancestry
AfghanAfricanAlaska NativeAlaskan AthabascanAlbanianAleutAlsatianAmericanApacheArabArapahoArgentineanArmenianAssyrian/Chaldean/SyriacAustralianAustrianBahamianBangladeshiBarbadianBasqueBelgianBelizeanBermudanBhutaneseBlackfeetBolivianBrazilianBritishBritish West IndianBulgarianBurmeseCajunCambodianCanadianCape VerdeanCarpatho RusynCelticCentral AmericanCentral American IndianCherokeeCheyenneChickasawChileanChineseChippewaChoctawColombianColvilleComancheCosta RicanCreeCreekCroatianCrowCubanCypriotCzechCzechoslovakianDanishDelawareDominicanDutchDutch West IndianEastern EuropeanEcuadorianEgyptianEnglishEstonianEthiopianEuropeanFijianFilipinoFinnishFrenchFrench American IndianFrench CanadianGermanGerman RussianGhanaianGreekGuamanian/ChamorroGuatemalanGuyaneseHmongHonduranHopiHoumaHungarianIcelanderIndian (Asian)IndonesianInupiatIranianIraqiIrishIroquoisIsraeliItalianJamaicanJapaneseJordanianKenyanKiowaKoreanLaotianLatvianLebaneseLiberianLithuanianLumbeeLuxembourgerMacedonianMalaysianMalteseMarshalleseMenomineeMexicanMexican American IndianMongolianMoroccanNative HawaiianNavajoNepaleseNew ZealanderNicaraguanNigerianNorthern EuropeanNorwegianOkinawanOsageOttawaPaiutePakistaniPalestinianPanamanianParaguayanPennsylvania GermanPeruvianPimaPolishPortuguesePotawatomiPuebloPuerto RicanPuget Sound SalishRomanianRussianSalvadoranSamoanScandinavianScotch-IrishScottishSeminoleSenegaleseSerbianShoshoneSierra LeoneanSiouxSlavicSlovakSloveneSomaliSouth AfricanSouth AmericanSouth American IndianSoviet UnionSpaniardSpanishSpanish AmericanSpanish American IndianSri LankanSubsaharan AfricanSudaneseSwedishSwissSyrianTaiwaneseThaiTlingit-HaidaTohono O'OdhamTonganTrinidadian and TobagonianTsimshianTurkishU.S. Virgin IslanderUgandanUkrainianUruguayanUteVenezuelanVietnameseWelshWest IndianYakamaYaquiYugoslavianYumanYup'ikZimbabwean
Immigration
NonimmigrantsImmigrantsAfghanistanAfricaAlbaniaArgentinaArmeniaAsiaAustraliaAustriaBahamasBangladeshBarbadosBelarusBelgiumBelizeBoliviaBosnia and HerzegovinaBrazilBulgariaBurma/MyanmarCabo VerdeCambodiaCameroonCanadaCaribbeanCentral AmericaChileChinaColombiaCongoCosta RicaCroatiaCubaCzechoslovakiaDenmarkDominicaDominican RepublicEastern AfricaEastern AsiaEastern EuropeEcuadorEgyptEl SalvadorEnglandEritreaEthiopiaEuropeFijiFranceGermanyGhanaGreeceGrenadaGuatemalaGuyanaHaitiHondurasHong KongHungaryIndiaIndonesiaIranIraqIrelandIsraelItalyJamaicaJapanJordanKazakhstanKenyaKoreaKuwaitLaosLatin AmericaLatviaLebanonLiberiaLithuaniaMalaysiaMexicoMicronesiaMiddle AfricaMoldovaMoroccoNepalNetherlandsNicaraguaNigeriaNorth AmericaNorth MacedoniaNorthern AfricaNorthern EuropeNorwayOceaniaPakistanPanamaPeruPhilippinesPolandPortugalRomaniaRussiaSaudi ArabiaScotlandSenegalSerbiaSierra LeoneSingaporeSomaliaSouth AfricaSouth AmericaSouth Central AsiaSouth Eastern AsiaSouthern EuropeSpainSri LankaSt. Vincent and the GrenadinesSudanSwedenSwitzerlandSyriaTaiwanThailandTrinidad and TobagoTurkeyUgandaUkraineUruguayUzbekistanVenezuelaVietnamWest IndiesWestern AfricaWestern AsiaWestern EuropeYemenZaireZimbabweAzores
Disability Age Under 5
Income
Poverty
Unemployment
Labor Participation
Family Structure
Vehicle Availability
Education Level
Disability

Disability Age Under 5 Comparison

Haitians

Immigrants from Vietnam

Fair
Exceptional
1.3%
DISABILITY AGE UNDER 5
39.9/ 100
METRIC RATING
188th/ 347
METRIC RANK
1.1%
DISABILITY AGE UNDER 5
99.1/ 100
METRIC RATING
63rd/ 347
METRIC RANK

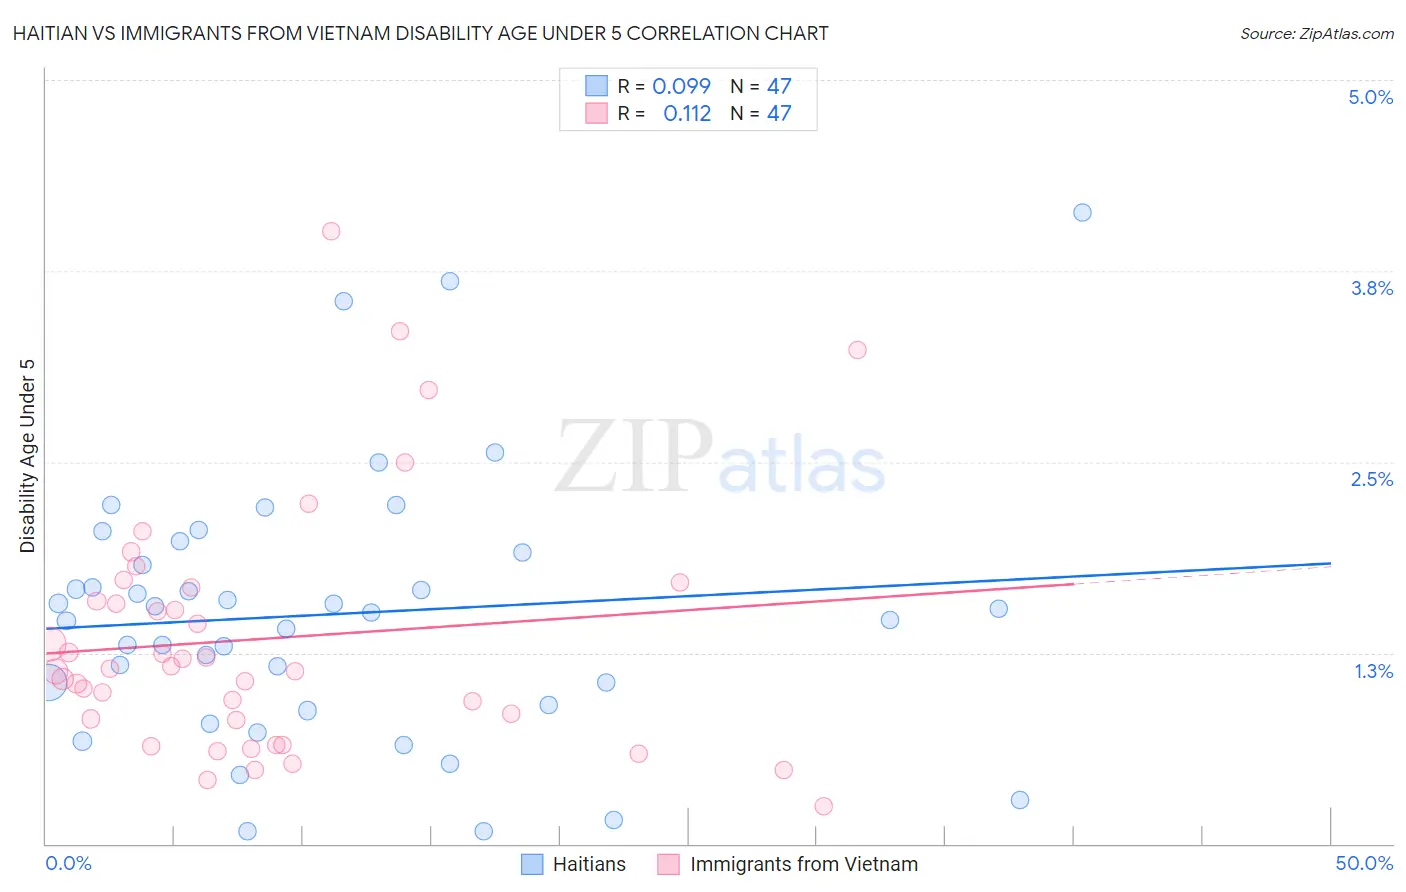
Haitian vs Immigrants from Vietnam Disability Age Under 5 Correlation Chart

The statistical analysis conducted on geographies consisting of 169,174,150 people shows a slight positive correlation between the proportion of Haitians and percentage of population with a disability under the age of 5 in the United States with a correlation coefficient (R) of 0.099 and weighted average of 1.3%. Similarly, the statistical analysis conducted on geographies consisting of 220,992,476 people shows a poor positive correlation between the proportion of Immigrants from Vietnam and percentage of population with a disability under the age of 5 in the United States with a correlation coefficient (R) of 0.112 and weighted average of 1.1%, a difference of 13.0%.
Haitian vs Immigrants from Vietnam Disability Age Under 5

Disability Age Under 5 Correlation Summary

MeasurementHaitianImmigrants from Vietnam
Minimum0.082%0.25%
Maximum4.1%4.0%
Range4.0%3.8%
Mean1.5%1.3%
Median1.5%1.1%
Interquartile 25% (IQ1)0.90%0.81%
Interquartile 75% (IQ3)1.9%1.7%
Interquartile Range (IQR)1.0%0.87%
Standard Deviation (Sample)0.86%0.81%
Standard Deviation (Population)0.85%0.80%

Similar Demographics by Disability Age Under 5

Demographics Similar to Haitians by Disability Age Under 5

In terms of disability age under 5, the demographic groups most similar to Haitians are Immigrants from Haiti (1.3%, a difference of 0.020%), Peruvian (1.3%, a difference of 0.22%), Cuban (1.2%, a difference of 0.23%), Immigrants from Western Africa (1.2%, a difference of 0.24%), and Palestinian (1.2%, a difference of 0.29%).
DemographicsRating | RankDisability Age Under 5
Macedonians
43.7
/100
|
#181
Average
1.2%
Immigrants | Peru
43.7
/100
|
#181
Average
1.2%
Immigrants | Saudi Arabia
43.3
/100
|
#183
Average
1.2%
Palestinians
43.0
/100
|
#184
Average
1.2%
Immigrants | Western Africa
42.5
/100
|
#185
Average
1.2%
Cubans
42.5
/100
|
#186
Average
1.2%
Immigrants | Haiti
40.2
/100
|
#187
Average
1.3%
Haitians
39.9
/100
|
#188
Fair
1.3%
Peruvians
37.6
/100
|
#189
Fair
1.3%
Immigrants | Laos
36.6
/100
|
#190
Fair
1.3%
Mexican American Indians
36.6
/100
|
#191
Fair
1.3%
Immigrants | Bosnia and Herzegovina
36.5
/100
|
#192
Fair
1.3%
Immigrants | Sierra Leone
36.5
/100
|
#193
Fair
1.3%
Immigrants | North Macedonia
34.7
/100
|
#194
Fair
1.3%
U.S. Virgin Islanders
34.4
/100
|
#195
Fair
1.3%

Demographics Similar to Immigrants from Vietnam by Disability Age Under 5

In terms of disability age under 5, the demographic groups most similar to Immigrants from Vietnam are Immigrants from Switzerland (1.1%, a difference of 0.11%), Immigrants from Ethiopia (1.1%, a difference of 0.12%), Immigrants from Western Asia (1.1%, a difference of 0.18%), Egyptian (1.1%, a difference of 0.46%), and Immigrants from Korea (1.1%, a difference of 0.80%).
DemographicsRating | RankDisability Age Under 5
Ecuadorians
99.5
/100
|
#56
Exceptional
1.1%
Assyrians/Chaldeans/Syriacs
99.5
/100
|
#57
Exceptional
1.1%
Immigrants | Egypt
99.4
/100
|
#58
Exceptional
1.1%
Immigrants | Malaysia
99.4
/100
|
#59
Exceptional
1.1%
Immigrants | Western Asia
99.2
/100
|
#60
Exceptional
1.1%
Immigrants | Ethiopia
99.2
/100
|
#61
Exceptional
1.1%
Immigrants | Switzerland
99.2
/100
|
#62
Exceptional
1.1%
Immigrants | Vietnam
99.1
/100
|
#63
Exceptional
1.1%
Egyptians
98.9
/100
|
#64
Exceptional
1.1%
Immigrants | Korea
98.8
/100
|
#65
Exceptional
1.1%
Immigrants | Indonesia
98.7
/100
|
#66
Exceptional
1.1%
Immigrants | Belize
98.7
/100
|
#67
Exceptional
1.1%
South Africans
98.7
/100
|
#68
Exceptional
1.1%
Israelis
98.7
/100
|
#69
Exceptional
1.1%
Immigrants | Ecuador
98.6
/100
|
#70
Exceptional
1.1%