Argentinean vs Nigerian Disability Age Under 5

COMPARE

Argentinean
Race
Ancestry
AfghanAfricanAlaska NativeAlaskan AthabascanAlbanianAleutAlsatianAmericanApacheArabArapahoArgentineanArmenianAssyrian/Chaldean/SyriacAustralianAustrianBahamianBangladeshiBarbadianBasqueBelgianBelizeanBermudanBhutaneseBlackfeetBolivianBrazilianBritishBritish West IndianBulgarianBurmeseCajunCambodianCanadianCape VerdeanCarpatho RusynCelticCentral AmericanCentral American IndianCherokeeCheyenneChickasawChileanChineseChippewaChoctawColombianColvilleComancheCosta RicanCreeCreekCroatianCrowCubanCypriotCzechCzechoslovakianDanishDelawareDominicanDutchDutch West IndianEastern EuropeanEcuadorianEgyptianEnglishEstonianEthiopianEuropeanFijianFilipinoFinnishFrenchFrench American IndianFrench CanadianGermanGerman RussianGhanaianGreekGuamanian/ChamorroGuatemalanGuyaneseHaitianHmongHonduranHopiHoumaHungarianIcelanderIndian (Asian)IndonesianInupiatIranianIraqiIrishIroquoisIsraeliItalianJamaicanJapaneseJordanianKenyanKiowaKoreanLaotianLatvianLebaneseLiberianLithuanianLumbeeLuxembourgerMacedonianMalaysianMalteseMarshalleseMenomineeMexicanMexican American IndianMongolianMoroccanNative HawaiianNavajoNepaleseNew ZealanderNicaraguanNorthern EuropeanNorwegianOkinawanOsageOttawaPaiutePakistaniPalestinianPanamanianParaguayanPennsylvania GermanPeruvianPimaPolishPortuguesePotawatomiPuebloPuerto RicanPuget Sound SalishRomanianRussianSalvadoranSamoanScandinavianScotch-IrishScottishSeminoleSenegaleseSerbianShoshoneSierra LeoneanSiouxSlavicSlovakSloveneSomaliSouth AfricanSouth AmericanSouth American IndianSoviet UnionSpaniardSpanishSpanish AmericanSpanish American IndianSri LankanSubsaharan AfricanSudaneseSwedishSwissSyrianTaiwaneseThaiTlingit-HaidaTohono O'OdhamTonganTrinidadian and TobagonianTsimshianTurkishU.S. Virgin IslanderUgandanUkrainianUruguayanUteVenezuelanVietnameseWelshWest IndianYakamaYaquiYugoslavianYumanYup'ikZimbabwean
Immigration
NonimmigrantsImmigrantsAfghanistanAfricaAlbaniaArgentinaArmeniaAsiaAustraliaAustriaBahamasBangladeshBarbadosBelarusBelgiumBelizeBoliviaBosnia and HerzegovinaBrazilBulgariaBurma/MyanmarCabo VerdeCambodiaCameroonCanadaCaribbeanCentral AmericaChileChinaColombiaCongoCosta RicaCroatiaCubaCzechoslovakiaDenmarkDominicaDominican RepublicEastern AfricaEastern AsiaEastern EuropeEcuadorEgyptEl SalvadorEnglandEritreaEthiopiaEuropeFijiFranceGermanyGhanaGreeceGrenadaGuatemalaGuyanaHaitiHondurasHong KongHungaryIndiaIndonesiaIranIraqIrelandIsraelItalyJamaicaJapanJordanKazakhstanKenyaKoreaKuwaitLaosLatin AmericaLatviaLebanonLiberiaLithuaniaMalaysiaMexicoMicronesiaMiddle AfricaMoldovaMoroccoNepalNetherlandsNicaraguaNigeriaNorth AmericaNorth MacedoniaNorthern AfricaNorthern EuropeNorwayOceaniaPakistanPanamaPeruPhilippinesPolandPortugalRomaniaRussiaSaudi ArabiaScotlandSenegalSerbiaSierra LeoneSingaporeSomaliaSouth AfricaSouth AmericaSouth Central AsiaSouth Eastern AsiaSouthern EuropeSpainSri LankaSt. Vincent and the GrenadinesSudanSwedenSwitzerlandSyriaTaiwanThailandTrinidad and TobagoTurkeyUgandaUkraineUruguayUzbekistanVenezuelaVietnamWest IndiesWestern AfricaWestern AsiaWestern EuropeYemenZaireZimbabweAzores
Nigerian
Race
Ancestry
AfghanAfricanAlaska NativeAlaskan AthabascanAlbanianAleutAlsatianAmericanApacheArabArapahoArmenianAssyrian/Chaldean/SyriacAustralianAustrianBahamianBangladeshiBarbadianBasqueBelgianBelizeanBermudanBhutaneseBlackfeetBolivianBrazilianBritishBritish West IndianBulgarianBurmeseCajunCambodianCanadianCape VerdeanCarpatho RusynCelticCentral AmericanCentral American IndianCherokeeCheyenneChickasawChileanChineseChippewaChoctawColombianColvilleComancheCosta RicanCreeCreekCroatianCrowCubanCypriotCzechCzechoslovakianDanishDelawareDominicanDutchDutch West IndianEastern EuropeanEcuadorianEgyptianEnglishEstonianEthiopianEuropeanFijianFilipinoFinnishFrenchFrench American IndianFrench CanadianGermanGerman RussianGhanaianGreekGuamanian/ChamorroGuatemalanGuyaneseHaitianHmongHonduranHopiHoumaHungarianIcelanderIndian (Asian)IndonesianInupiatIranianIraqiIrishIroquoisIsraeliItalianJamaicanJapaneseJordanianKenyanKiowaKoreanLaotianLatvianLebaneseLiberianLithuanianLumbeeLuxembourgerMacedonianMalaysianMalteseMarshalleseMenomineeMexicanMexican American IndianMongolianMoroccanNative HawaiianNavajoNepaleseNew ZealanderNicaraguanNigerianNorthern EuropeanNorwegianOkinawanOsageOttawaPaiutePakistaniPalestinianPanamanianParaguayanPennsylvania GermanPeruvianPimaPolishPortuguesePotawatomiPuebloPuerto RicanPuget Sound SalishRomanianRussianSalvadoranSamoanScandinavianScotch-IrishScottishSeminoleSenegaleseSerbianShoshoneSierra LeoneanSiouxSlavicSlovakSloveneSomaliSouth AfricanSouth AmericanSouth American IndianSoviet UnionSpaniardSpanishSpanish AmericanSpanish American IndianSri LankanSubsaharan AfricanSudaneseSwedishSwissSyrianTaiwaneseThaiTlingit-HaidaTohono O'OdhamTonganTrinidadian and TobagonianTsimshianTurkishU.S. Virgin IslanderUgandanUkrainianUruguayanUteVenezuelanVietnameseWelshWest IndianYakamaYaquiYugoslavianYumanYup'ikZimbabwean
Immigration
NonimmigrantsImmigrantsAfghanistanAfricaAlbaniaArgentinaArmeniaAsiaAustraliaAustriaBahamasBangladeshBarbadosBelarusBelgiumBelizeBoliviaBosnia and HerzegovinaBrazilBulgariaBurma/MyanmarCabo VerdeCambodiaCameroonCanadaCaribbeanCentral AmericaChileChinaColombiaCongoCosta RicaCroatiaCubaCzechoslovakiaDenmarkDominicaDominican RepublicEastern AfricaEastern AsiaEastern EuropeEcuadorEgyptEl SalvadorEnglandEritreaEthiopiaEuropeFijiFranceGermanyGhanaGreeceGrenadaGuatemalaGuyanaHaitiHondurasHong KongHungaryIndiaIndonesiaIranIraqIrelandIsraelItalyJamaicaJapanJordanKazakhstanKenyaKoreaKuwaitLaosLatin AmericaLatviaLebanonLiberiaLithuaniaMalaysiaMexicoMicronesiaMiddle AfricaMoldovaMoroccoNepalNetherlandsNicaraguaNigeriaNorth AmericaNorth MacedoniaNorthern AfricaNorthern EuropeNorwayOceaniaPakistanPanamaPeruPhilippinesPolandPortugalRomaniaRussiaSaudi ArabiaScotlandSenegalSerbiaSierra LeoneSingaporeSomaliaSouth AfricaSouth AmericaSouth Central AsiaSouth Eastern AsiaSouthern EuropeSpainSri LankaSt. Vincent and the GrenadinesSudanSwedenSwitzerlandSyriaTaiwanThailandTrinidad and TobagoTurkeyUgandaUkraineUruguayUzbekistanVenezuelaVietnamWest IndiesWestern AfricaWestern AsiaWestern EuropeYemenZaireZimbabweAzores
Disability Age Under 5
Income
Poverty
Unemployment
Labor Participation
Family Structure
Vehicle Availability
Education Level
Disability

Disability Age Under 5 Comparison

Argentineans

Nigerians

Excellent
Fair
1.2%
DISABILITY AGE UNDER 5
85.7/ 100
METRIC RATING
134th/ 347
METRIC RANK
1.3%
DISABILITY AGE UNDER 5
21.2/ 100
METRIC RATING
207th/ 347
METRIC RANK

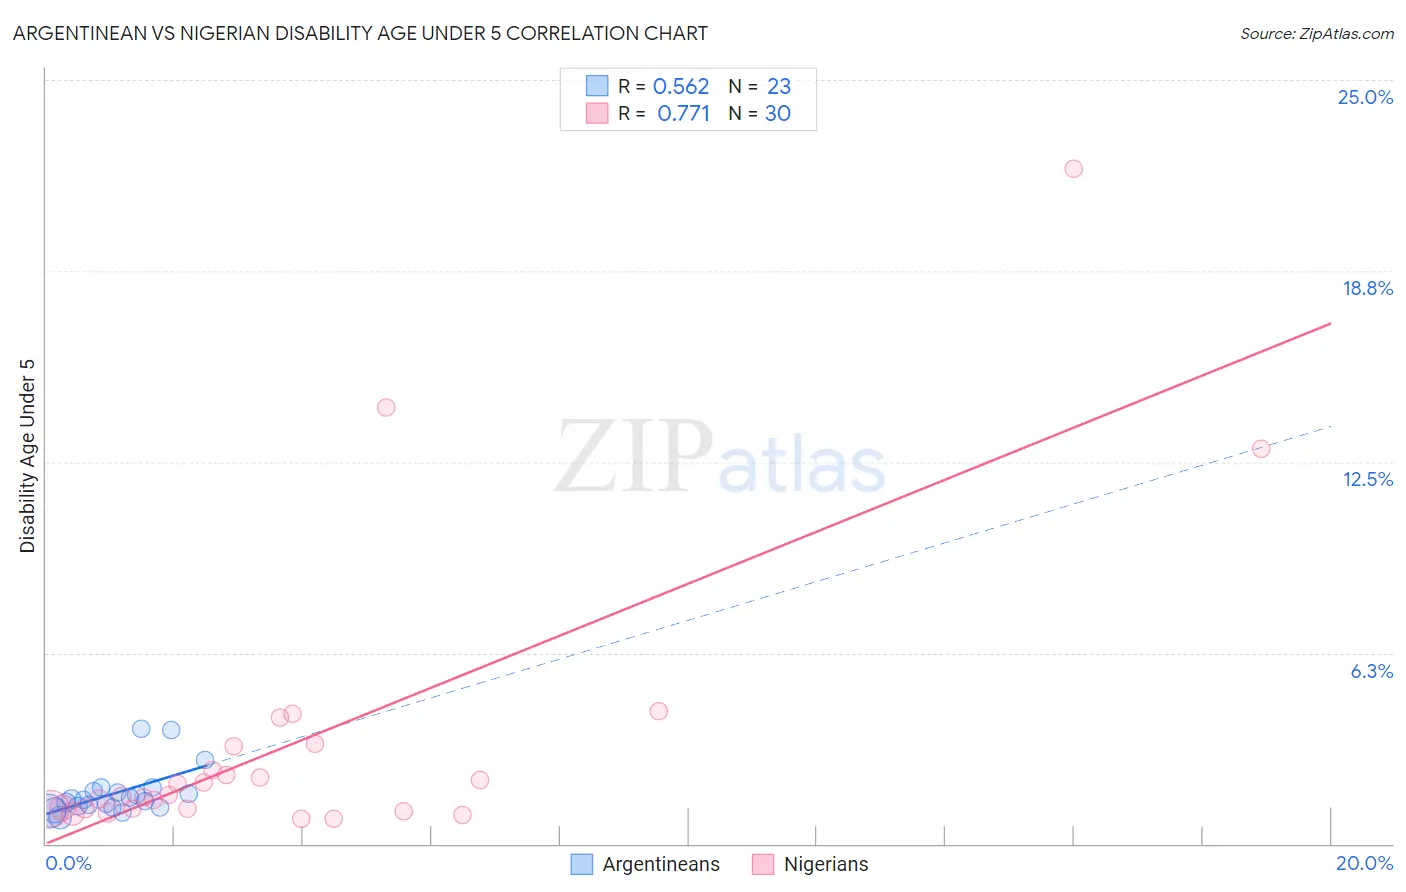
Argentinean vs Nigerian Disability Age Under 5 Correlation Chart

The statistical analysis conducted on geographies consisting of 177,264,902 people shows a substantial positive correlation between the proportion of Argentineans and percentage of population with a disability under the age of 5 in the United States with a correlation coefficient (R) of 0.562 and weighted average of 1.2%. Similarly, the statistical analysis conducted on geographies consisting of 194,464,110 people shows a strong positive correlation between the proportion of Nigerians and percentage of population with a disability under the age of 5 in the United States with a correlation coefficient (R) of 0.771 and weighted average of 1.3%, a difference of 7.3%.
Argentinean vs Nigerian Disability Age Under 5

Disability Age Under 5 Correlation Summary

MeasurementArgentineanNigerian
Minimum0.86%0.82%
Maximum3.8%22.1%
Range2.9%21.3%
Mean1.7%3.3%
Median1.4%1.6%
Interquartile 25% (IQ1)1.2%1.2%
Interquartile 75% (IQ3)1.7%3.2%
Interquartile Range (IQR)0.55%2.0%
Standard Deviation (Sample)0.76%4.7%
Standard Deviation (Population)0.75%4.7%

Similar Demographics by Disability Age Under 5

Demographics Similar to Argentineans by Disability Age Under 5

In terms of disability age under 5, the demographic groups most similar to Argentineans are Immigrants from Spain (1.2%, a difference of 0.16%), Fijian (1.2%, a difference of 0.20%), Immigrants from Eastern Europe (1.2%, a difference of 0.31%), Immigrants from Serbia (1.2%, a difference of 0.38%), and Moroccan (1.2%, a difference of 0.38%).
DemographicsRating | RankDisability Age Under 5
Immigrants | Romania
88.4
/100
|
#127
Excellent
1.2%
Immigrants | France
88.4
/100
|
#128
Excellent
1.2%
Immigrants | Immigrants
88.0
/100
|
#129
Excellent
1.2%
Koreans
87.7
/100
|
#130
Excellent
1.2%
Immigrants | Serbia
87.6
/100
|
#131
Excellent
1.2%
Immigrants | Eastern Europe
87.3
/100
|
#132
Excellent
1.2%
Immigrants | Spain
86.5
/100
|
#133
Excellent
1.2%
Argentineans
85.7
/100
|
#134
Excellent
1.2%
Fijians
84.7
/100
|
#135
Excellent
1.2%
Moroccans
83.6
/100
|
#136
Excellent
1.2%
Immigrants | Eastern Africa
83.1
/100
|
#137
Excellent
1.2%
Immigrants | Czechoslovakia
82.8
/100
|
#138
Excellent
1.2%
New Zealanders
81.4
/100
|
#139
Excellent
1.2%
Somalis
80.8
/100
|
#140
Excellent
1.2%
Immigrants | Honduras
80.4
/100
|
#141
Excellent
1.2%

Demographics Similar to Nigerians by Disability Age Under 5

In terms of disability age under 5, the demographic groups most similar to Nigerians are Mexican (1.3%, a difference of 0.060%), Immigrants from Poland (1.3%, a difference of 0.15%), Romanian (1.3%, a difference of 0.17%), Bulgarian (1.3%, a difference of 0.23%), and Pakistani (1.3%, a difference of 0.24%).
DemographicsRating | RankDisability Age Under 5
Immigrants | Lithuania
27.2
/100
|
#200
Fair
1.3%
Immigrants | Italy
25.4
/100
|
#201
Fair
1.3%
Arapaho
24.1
/100
|
#202
Fair
1.3%
Liberians
24.0
/100
|
#203
Fair
1.3%
Immigrants | Europe
23.6
/100
|
#204
Fair
1.3%
Romanians
22.5
/100
|
#205
Fair
1.3%
Immigrants | Poland
22.4
/100
|
#206
Fair
1.3%
Nigerians
21.2
/100
|
#207
Fair
1.3%
Mexicans
20.8
/100
|
#208
Fair
1.3%
Bulgarians
19.5
/100
|
#209
Poor
1.3%
Pakistanis
19.4
/100
|
#210
Poor
1.3%
Immigrants | Greece
19.1
/100
|
#211
Poor
1.3%
Chileans
18.8
/100
|
#212
Poor
1.3%
Immigrants | Sudan
18.7
/100
|
#213
Poor
1.3%
Immigrants | Chile
17.2
/100
|
#214
Poor
1.3%