Zip Codes with the Highest Percentage of Population Employed in Agriculture, Fishing & Hunting in Durango, CO
RELATED REPORTS & OPTIONS
Agriculture, Fishing & Hunting
Durango
Compare Zip Codes
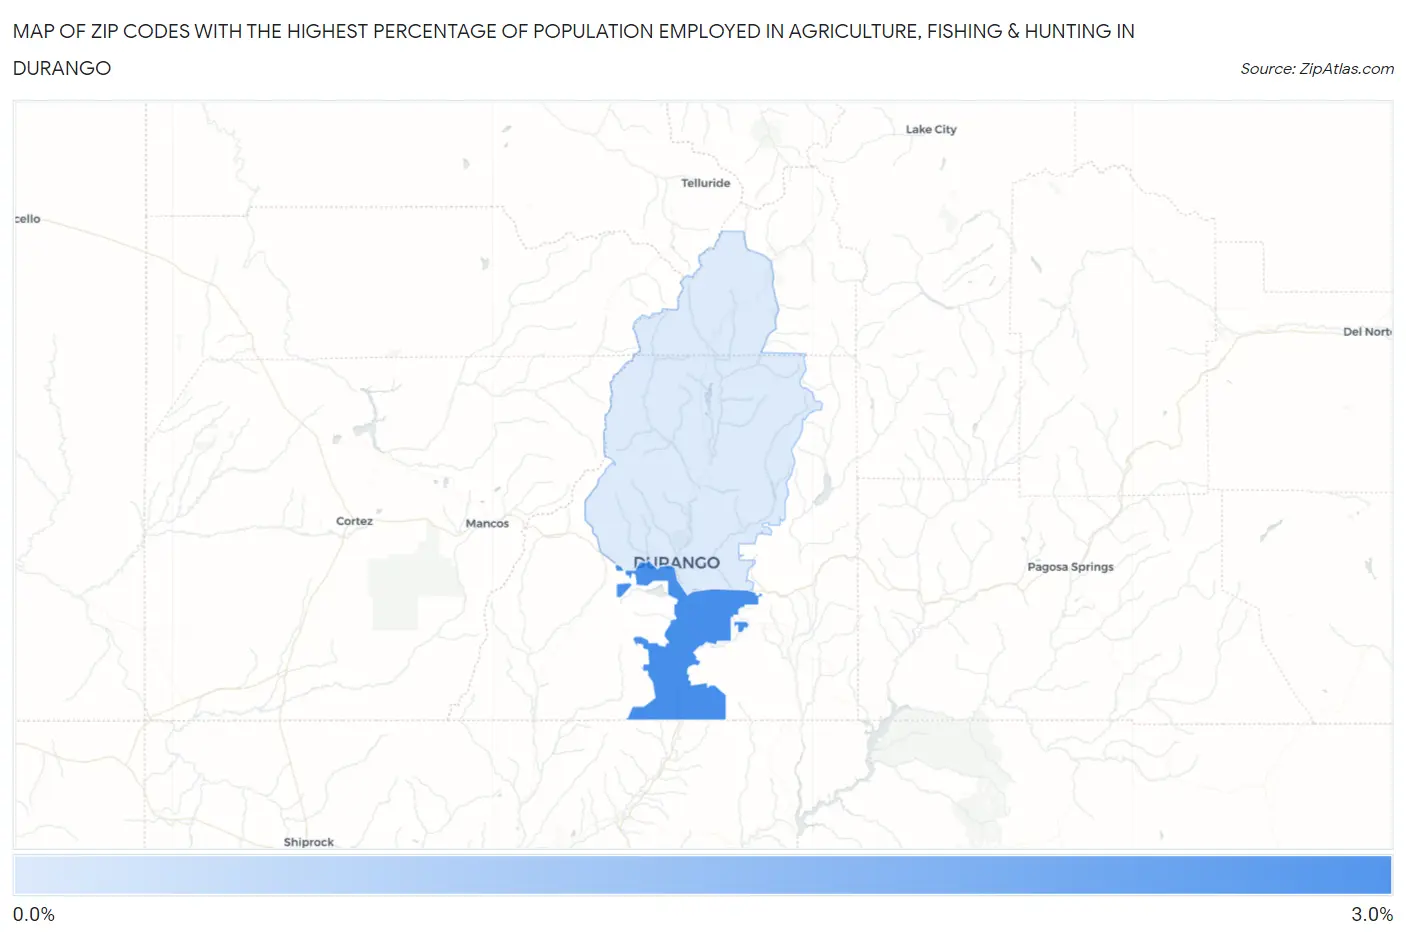
Map of Zip Codes with the Highest Percentage of Population Employed in Agriculture, Fishing & Hunting in Durango
0.96%
2.6%
Zip Codes with the Highest Percentage of Population Employed in Agriculture, Fishing & Hunting in Durango, CO
| Zip Code | % Employed | vs State | vs National | |
| 1. | 81303 | 2.6% | 1.1%(+1.47)#203 | 1.2%(+1.42)#11,323 |
| 2. | 81301 | 0.96% | 1.1%(-0.186)#288 | 1.2%(-0.238)#16,397 |
1
Common Questions
What are the Top Zip Codes with the Highest Percentage of Population Employed in Agriculture, Fishing & Hunting in Durango, CO?
Top Zip Codes with the Highest Percentage of Population Employed in Agriculture, Fishing & Hunting in Durango, CO are:
What zip code has the Highest Percentage of Population Employed in Agriculture, Fishing & Hunting in Durango, CO?
81303 has the Highest Percentage of Population Employed in Agriculture, Fishing & Hunting in Durango, CO with 2.6%.
What is the Percentage of Population Employed in Agriculture, Fishing & Hunting in Durango, CO?
Percentage of Population Employed in Agriculture, Fishing & Hunting in Durango is 0.63%.
What is the Percentage of Population Employed in Agriculture, Fishing & Hunting in Colorado?
Percentage of Population Employed in Agriculture, Fishing & Hunting in Colorado is 1.1%.
What is the Percentage of Population Employed in Agriculture, Fishing & Hunting in the United States?
Percentage of Population Employed in Agriculture, Fishing & Hunting in the United States is 1.2%.