Zip Codes with the Highest Percentage of Population Employed in Legal Services & Support in San Francisco, CA
RELATED REPORTS & OPTIONS
Legal Services & Support
San Francisco
Compare Zip Codes
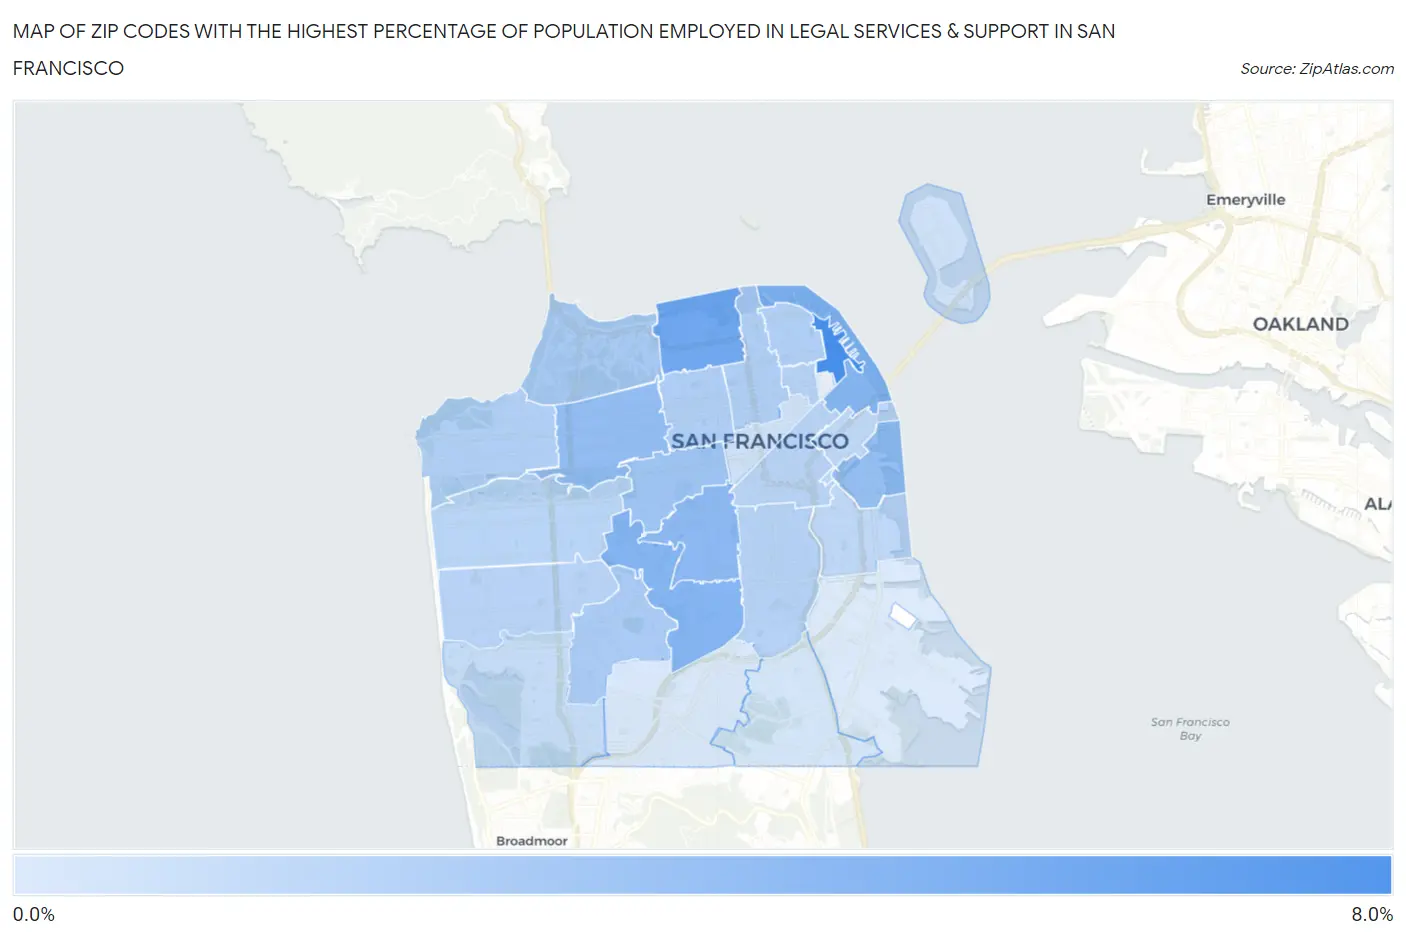
Map of Zip Codes with the Highest Percentage of Population Employed in Legal Services & Support in San Francisco
0.83%
7.6%
Zip Codes with the Highest Percentage of Population Employed in Legal Services & Support in San Francisco, CA
| Zip Code | % Employed | vs State | vs National | |
| 1. | 94111 | 7.6% | 1.3%(+6.30)#19 | 1.2%(+6.38)#294 |
| 2. | 94123 | 5.6% | 1.3%(+4.38)#41 | 1.2%(+4.45)#571 |
| 3. | 94105 | 4.7% | 1.3%(+3.47)#65 | 1.2%(+3.54)#800 |
| 4. | 94131 | 4.7% | 1.3%(+3.41)#69 | 1.2%(+3.49)#820 |
| 5. | 94114 | 4.4% | 1.3%(+3.14)#83 | 1.2%(+3.21)#939 |
| 6. | 94118 | 4.1% | 1.3%(+2.80)#96 | 1.2%(+2.88)#1,099 |
| 7. | 94158 | 4.0% | 1.3%(+2.76)#98 | 1.2%(+2.84)#1,114 |
| 8. | 94117 | 3.6% | 1.3%(+2.30)#124 | 1.2%(+2.37)#1,381 |
| 9. | 94127 | 3.0% | 1.3%(+1.78)#162 | 1.2%(+1.86)#1,807 |
| 10. | 94129 | 3.0% | 1.3%(+1.76)#164 | 1.2%(+1.83)#1,825 |
| 11. | 94115 | 2.9% | 1.3%(+1.64)#180 | 1.2%(+1.72)#1,972 |
| 12. | 94109 | 2.9% | 1.3%(+1.63)#183 | 1.2%(+1.71)#1,979 |
| 13. | 94121 | 2.8% | 1.3%(+1.52)#187 | 1.2%(+1.60)#2,102 |
| 14. | 94133 | 2.8% | 1.3%(+1.50)#190 | 1.2%(+1.58)#2,123 |
| 15. | 94110 | 2.6% | 1.3%(+1.31)#209 | 1.2%(+1.38)#2,408 |
| 16. | 94108 | 2.5% | 1.3%(+1.26)#219 | 1.2%(+1.33)#2,488 |
| 17. | 94116 | 2.5% | 1.3%(+1.21)#221 | 1.2%(+1.29)#2,570 |
| 18. | 94103 | 2.4% | 1.3%(+1.16)#230 | 1.2%(+1.24)#2,639 |
| 19. | 94122 | 2.3% | 1.3%(+1.06)#246 | 1.2%(+1.13)#2,817 |
| 20. | 94107 | 2.1% | 1.3%(+0.885)#275 | 1.2%(+0.959)#3,152 |
| 21. | 94132 | 1.8% | 1.3%(+0.582)#334 | 1.2%(+0.656)#3,894 |
| 22. | 94130 | 1.4% | 1.3%(+0.176)#445 | 1.2%(+0.250)#5,319 |
| 23. | 94102 | 1.4% | 1.3%(+0.151)#455 | 1.2%(+0.226)#5,428 |
| 24. | 94134 | 1.1% | 1.3%(-0.144)#585 | 1.2%(-0.069)#7,057 |
| 25. | 94112 | 1.0% | 1.3%(-0.227)#619 | 1.2%(-0.152)#7,608 |
| 26. | 94124 | 0.83% | 1.3%(-0.428)#727 | 1.2%(-0.354)#9,190 |
1
Common Questions
What are the Top 10 Zip Codes with the Highest Percentage of Population Employed in Legal Services & Support in San Francisco, CA?
Top 10 Zip Codes with the Highest Percentage of Population Employed in Legal Services & Support in San Francisco, CA are:
What zip code has the Highest Percentage of Population Employed in Legal Services & Support in San Francisco, CA?
94111 has the Highest Percentage of Population Employed in Legal Services & Support in San Francisco, CA with 7.6%.
What is the Percentage of Population Employed in Legal Services & Support in San Francisco, CA?
Percentage of Population Employed in Legal Services & Support in San Francisco is 2.7%.
What is the Percentage of Population Employed in Legal Services & Support in California?
Percentage of Population Employed in Legal Services & Support in California is 1.3%.
What is the Percentage of Population Employed in Legal Services & Support in the United States?
Percentage of Population Employed in Legal Services & Support in the United States is 1.2%.