Zip Codes with the Highest Percentage of Population Employed in Food Preparation & Serving in San Diego, CA
RELATED REPORTS & OPTIONS
Food Preparation & Serving
San Diego
Compare Zip Codes
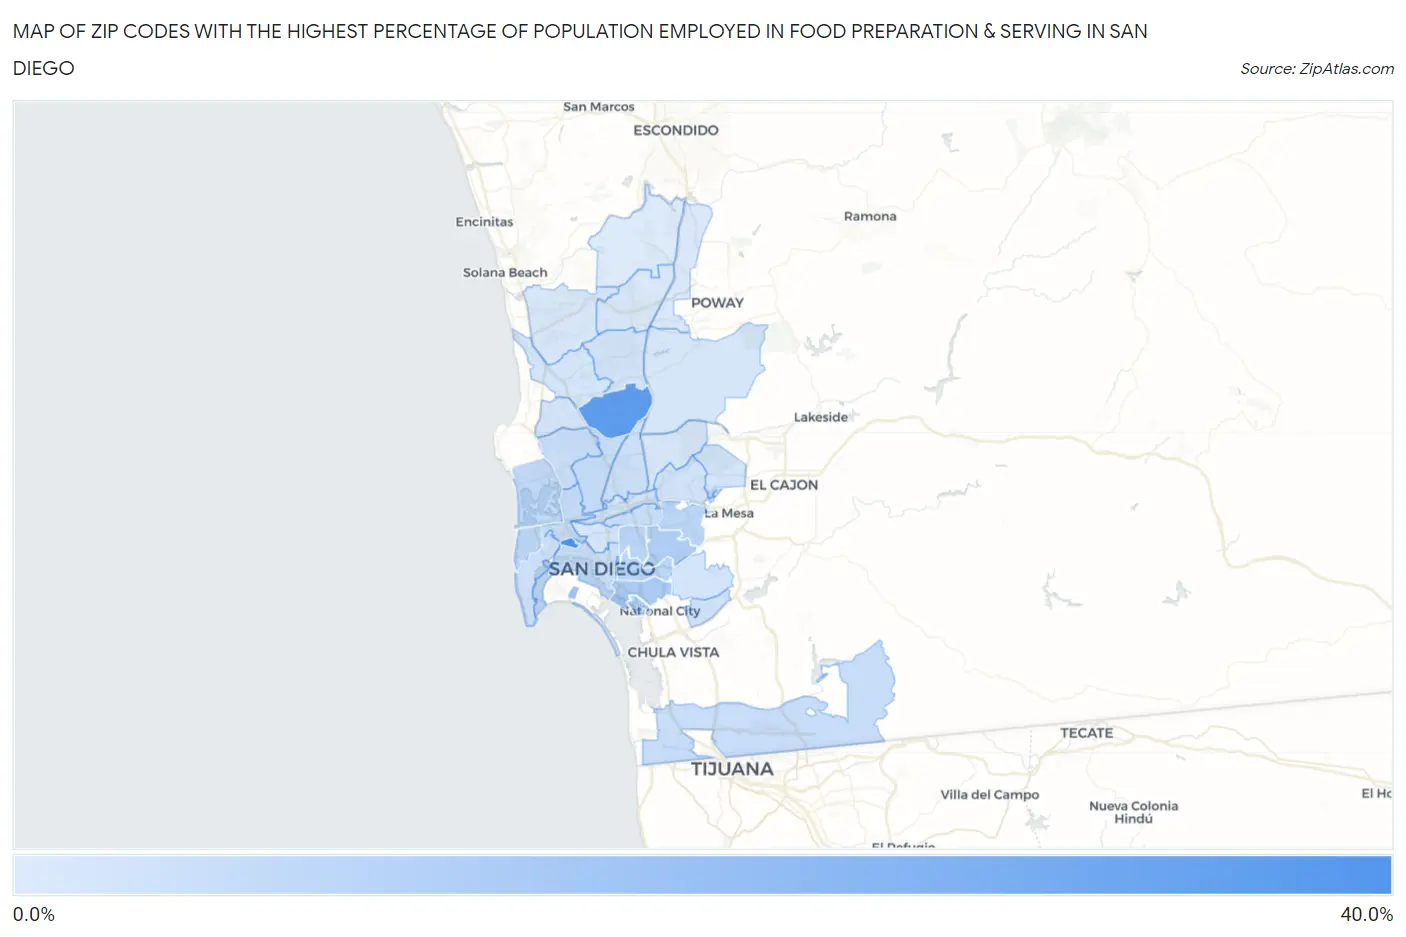
Map of Zip Codes with the Highest Percentage of Population Employed in Food Preparation & Serving in San Diego
2.3%
37.0%
Zip Codes with the Highest Percentage of Population Employed in Food Preparation & Serving in San Diego, CA
| Zip Code | % Employed | vs State | vs National | |
| 1. | 92140 | 37.0% | 5.4%(+31.6)#11 | 5.3%(+31.7)#130 |
| 2. | 92145 | 31.0% | 5.4%(+25.7)#13 | 5.3%(+25.7)#195 |
| 3. | 92135 | 15.8% | 5.4%(+10.4)#47 | 5.3%(+10.5)#883 |
| 4. | 92113 | 12.7% | 5.4%(+7.29)#71 | 5.3%(+7.39)#1,477 |
| 5. | 92136 | 12.1% | 5.4%(+6.76)#76 | 5.3%(+6.85)#1,618 |
| 6. | 92105 | 11.8% | 5.4%(+6.40)#82 | 5.3%(+6.49)#1,740 |
| 7. | 92115 | 9.6% | 5.4%(+4.20)#158 | 5.3%(+4.30)#2,993 |
| 8. | 92104 | 9.5% | 5.4%(+4.09)#164 | 5.3%(+4.18)#3,083 |
| 9. | 92102 | 9.3% | 5.4%(+3.97)#169 | 5.3%(+4.06)#3,190 |
| 10. | 92107 | 9.0% | 5.4%(+3.63)#180 | 5.3%(+3.72)#3,523 |
| 11. | 92109 | 8.0% | 5.4%(+2.58)#233 | 5.3%(+2.67)#4,790 |
| 12. | 92111 | 7.0% | 5.4%(+1.66)#335 | 5.3%(+1.75)#6,462 |
| 13. | 92110 | 6.9% | 5.4%(+1.54)#353 | 5.3%(+1.64)#6,754 |
| 14. | 92154 | 6.5% | 5.4%(+1.13)#438 | 5.3%(+1.23)#7,840 |
| 15. | 92117 | 6.3% | 5.4%(+0.940)#479 | 5.3%(+1.04)#8,365 |
| 16. | 92116 | 6.3% | 5.4%(+0.907)#484 | 5.3%(+1.00)#8,463 |
| 17. | 92101 | 5.5% | 5.4%(+0.166)#645 | 5.3%(+0.262)#10,900 |
| 18. | 92123 | 5.5% | 5.4%(+0.109)#662 | 5.3%(+0.206)#11,091 |
| 19. | 92106 | 5.3% | 5.4%(-0.070)#704 | 5.3%(+0.026)#11,716 |
| 20. | 92139 | 5.0% | 5.4%(-0.413)#792 | 5.3%(-0.317)#13,062 |
| 21. | 92108 | 4.8% | 5.4%(-0.557)#829 | 5.3%(-0.460)#13,659 |
| 22. | 92120 | 4.7% | 5.4%(-0.663)#849 | 5.3%(-0.566)#14,088 |
| 23. | 92126 | 4.4% | 5.4%(-0.997)#938 | 5.3%(-0.900)#15,484 |
| 24. | 92114 | 4.4% | 5.4%(-1.02)#947 | 5.3%(-0.924)#15,593 |
| 25. | 92121 | 4.3% | 5.4%(-1.06)#960 | 5.3%(-0.966)#15,793 |
| 26. | 92122 | 4.3% | 5.4%(-1.11)#973 | 5.3%(-1.02)#16,018 |
| 27. | 92103 | 4.1% | 5.4%(-1.29)#1,003 | 5.3%(-1.19)#16,744 |
| 28. | 92119 | 4.0% | 5.4%(-1.43)#1,032 | 5.3%(-1.33)#17,325 |
| 29. | 92131 | 3.8% | 5.4%(-1.57)#1,054 | 5.3%(-1.47)#17,888 |
| 30. | 92129 | 3.3% | 5.4%(-2.04)#1,148 | 5.3%(-1.94)#19,869 |
| 31. | 92124 | 3.3% | 5.4%(-2.04)#1,149 | 5.3%(-1.94)#19,870 |
| 32. | 92130 | 3.1% | 5.4%(-2.24)#1,192 | 5.3%(-2.14)#20,684 |
| 33. | 92128 | 2.7% | 5.4%(-2.67)#1,276 | 5.3%(-2.57)#22,385 |
| 34. | 92127 | 2.3% | 5.4%(-3.11)#1,346 | 5.3%(-3.01)#23,867 |
1
Common Questions
What are the Top 10 Zip Codes with the Highest Percentage of Population Employed in Food Preparation & Serving in San Diego, CA?
Top 10 Zip Codes with the Highest Percentage of Population Employed in Food Preparation & Serving in San Diego, CA are:
What zip code has the Highest Percentage of Population Employed in Food Preparation & Serving in San Diego, CA?
92140 has the Highest Percentage of Population Employed in Food Preparation & Serving in San Diego, CA with 37.0%.
What is the Percentage of Population Employed in Food Preparation & Serving in San Diego, CA?
Percentage of Population Employed in Food Preparation & Serving in San Diego is 6.2%.
What is the Percentage of Population Employed in Food Preparation & Serving in California?
Percentage of Population Employed in Food Preparation & Serving in California is 5.4%.
What is the Percentage of Population Employed in Food Preparation & Serving in the United States?
Percentage of Population Employed in Food Preparation & Serving in the United States is 5.3%.