Zip Codes with the Highest Percentage of Population Employed in Firefighting & Prevention in San Diego, CA
RELATED REPORTS & OPTIONS
Firefighting & Prevention
San Diego
Compare Zip Codes
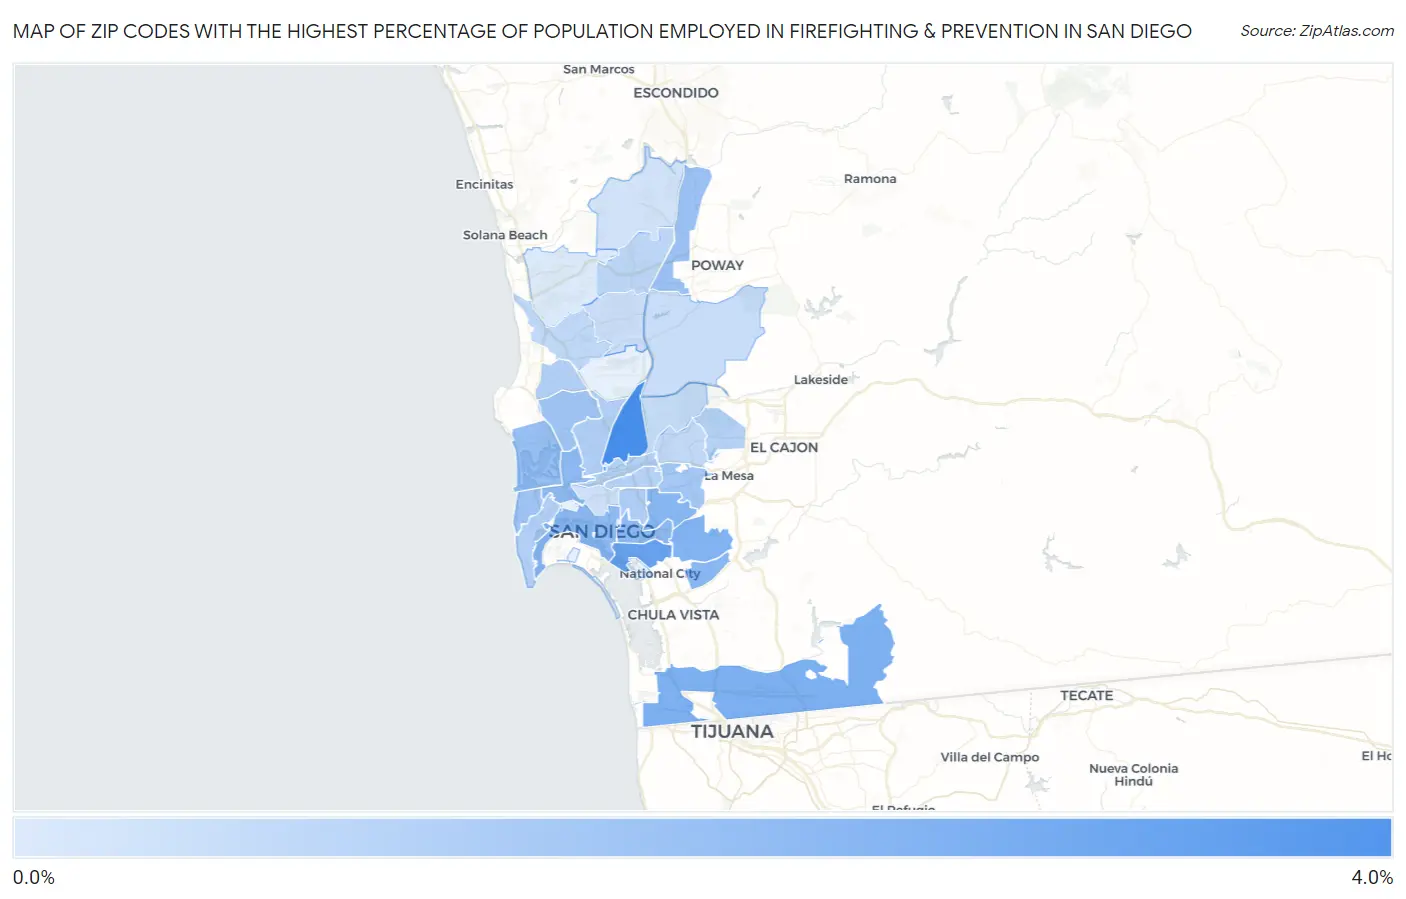
Map of Zip Codes with the Highest Percentage of Population Employed in Firefighting & Prevention in San Diego
0.093%
3.2%
Zip Codes with the Highest Percentage of Population Employed in Firefighting & Prevention in San Diego, CA
| Zip Code | % Employed | vs State | vs National | |
| 1. | 92123 | 3.2% | 1.3%(+1.94)#122 | 1.2%(+2.02)#2,009 |
| 2. | 92113 | 2.5% | 1.3%(+1.27)#191 | 1.2%(+1.36)#2,998 |
| 3. | 92154 | 2.1% | 1.3%(+0.826)#264 | 1.2%(+0.915)#4,148 |
| 4. | 92114 | 2.0% | 1.3%(+0.701)#304 | 1.2%(+0.791)#4,604 |
| 5. | 92105 | 1.8% | 1.3%(+0.574)#345 | 1.2%(+0.664)#5,140 |
| 6. | 92139 | 1.8% | 1.3%(+0.536)#363 | 1.2%(+0.626)#5,295 |
| 7. | 92102 | 1.7% | 1.3%(+0.464)#396 | 1.2%(+0.554)#5,630 |
| 8. | 92110 | 1.7% | 1.3%(+0.448)#401 | 1.2%(+0.538)#5,717 |
| 9. | 92101 | 1.7% | 1.3%(+0.423)#414 | 1.2%(+0.512)#5,855 |
| 10. | 92109 | 1.5% | 1.3%(+0.257)#485 | 1.2%(+0.347)#6,761 |
| 11. | 92128 | 1.4% | 1.3%(+0.153)#536 | 1.2%(+0.242)#7,451 |
| 12. | 92107 | 1.3% | 1.3%(+0.074)#582 | 1.2%(+0.164)#7,986 |
| 13. | 92117 | 1.3% | 1.3%(+0.052)#594 | 1.2%(+0.142)#8,135 |
| 14. | 92115 | 1.3% | 1.3%(+0.012)#623 | 1.2%(+0.102)#8,439 |
| 15. | 92104 | 1.0% | 1.3%(-0.256)#816 | 1.2%(-0.166)#10,871 |
| 16. | 92111 | 1.0% | 1.3%(-0.266)#826 | 1.2%(-0.176)#10,996 |
| 17. | 92106 | 0.98% | 1.3%(-0.296)#849 | 1.2%(-0.206)#11,303 |
| 18. | 92122 | 0.95% | 1.3%(-0.322)#871 | 1.2%(-0.232)#11,600 |
| 19. | 92108 | 0.94% | 1.3%(-0.331)#876 | 1.2%(-0.241)#11,699 |
| 20. | 92116 | 0.92% | 1.3%(-0.357)#899 | 1.2%(-0.268)#11,962 |
| 21. | 92119 | 0.89% | 1.3%(-0.388)#928 | 1.2%(-0.298)#12,295 |
| 22. | 92129 | 0.76% | 1.3%(-0.519)#1,002 | 1.2%(-0.429)#13,687 |
| 23. | 92121 | 0.73% | 1.3%(-0.549)#1,021 | 1.2%(-0.459)#14,027 |
| 24. | 92120 | 0.66% | 1.3%(-0.613)#1,074 | 1.2%(-0.523)#14,759 |
| 25. | 92124 | 0.58% | 1.3%(-0.696)#1,121 | 1.2%(-0.607)#15,638 |
| 26. | 92131 | 0.53% | 1.3%(-0.743)#1,147 | 1.2%(-0.653)#16,159 |
| 27. | 92126 | 0.47% | 1.3%(-0.806)#1,172 | 1.2%(-0.716)#16,890 |
| 28. | 92103 | 0.43% | 1.3%(-0.841)#1,193 | 1.2%(-0.751)#17,278 |
| 29. | 92127 | 0.35% | 1.3%(-0.925)#1,241 | 1.2%(-0.835)#18,229 |
| 30. | 92130 | 0.093% | 1.3%(-1.18)#1,326 | 1.2%(-1.09)#20,335 |
1
Common Questions
What are the Top 10 Zip Codes with the Highest Percentage of Population Employed in Firefighting & Prevention in San Diego, CA?
Top 10 Zip Codes with the Highest Percentage of Population Employed in Firefighting & Prevention in San Diego, CA are:
What zip code has the Highest Percentage of Population Employed in Firefighting & Prevention in San Diego, CA?
92123 has the Highest Percentage of Population Employed in Firefighting & Prevention in San Diego, CA with 3.2%.
What is the Percentage of Population Employed in Firefighting & Prevention in San Diego, CA?
Percentage of Population Employed in Firefighting & Prevention in San Diego is 1.2%.
What is the Percentage of Population Employed in Firefighting & Prevention in California?
Percentage of Population Employed in Firefighting & Prevention in California is 1.3%.
What is the Percentage of Population Employed in Firefighting & Prevention in the United States?
Percentage of Population Employed in Firefighting & Prevention in the United States is 1.2%.