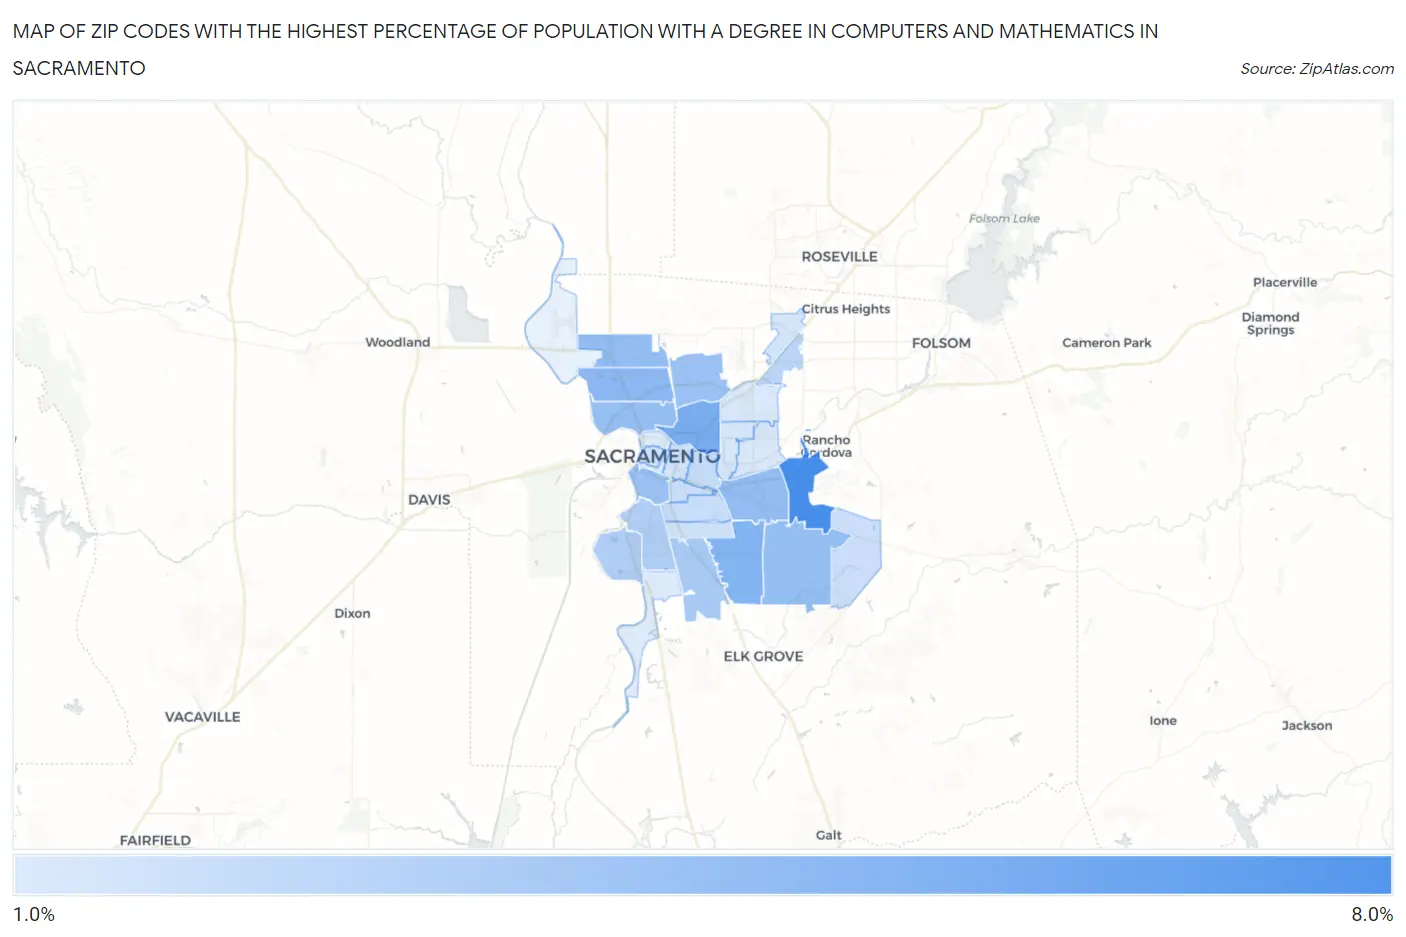
Zip Codes with the Highest Percentage of Population with a Degree in Computers and Mathematics in Sacramento, CA
RELATED REPORTS & OPTIONS
Computers and Mathematics
Sacramento
Compare Zip Codes
Map of Zip Codes with the Highest Percentage of Population with a Degree in Computers and Mathematics in Sacramento
2.0%
7.0%
Zip Codes with the Highest Percentage of Population with a Degree in Computers and Mathematics in Sacramento, CA
| Zip Code | % Graduates | vs State | vs National | |
| 1. | 95827 | 7.0% | 5.8%(+1.20)#260 | 4.9%(+2.12)#3,809 |
| 2. | 95815 | 5.4% | 5.8%(-0.436)#482 | 4.9%(+0.483)#6,557 |
| 3. | 95828 | 5.0% | 5.8%(-0.823)#553 | 4.9%(+0.096)#7,477 |
| 4. | 95834 | 4.7% | 5.8%(-1.15)#621 | 4.9%(-0.232)#8,384 |
| 5. | 95826 | 4.4% | 5.8%(-1.41)#678 | 4.9%(-0.486)#9,177 |
| 6. | 95835 | 4.4% | 5.8%(-1.44)#686 | 4.9%(-0.517)#9,272 |
| 7. | 95833 | 4.3% | 5.8%(-1.47)#691 | 4.9%(-0.551)#9,379 |
| 8. | 95829 | 4.3% | 5.8%(-1.47)#693 | 4.9%(-0.555)#9,397 |
| 9. | 95838 | 4.2% | 5.8%(-1.66)#731 | 4.9%(-0.742)#9,983 |
| 10. | 95818 | 4.1% | 5.8%(-1.70)#740 | 4.9%(-0.778)#10,088 |
| 11. | 95823 | 3.7% | 5.8%(-2.08)#834 | 4.9%(-1.16)#11,415 |
| 12. | 95831 | 3.5% | 5.8%(-2.34)#898 | 4.9%(-1.42)#12,390 |
| 13. | 95822 | 3.4% | 5.8%(-2.42)#913 | 4.9%(-1.50)#12,679 |
| 14. | 95841 | 3.1% | 5.8%(-2.73)#982 | 4.9%(-1.81)#13,769 |
| 15. | 95819 | 2.7% | 5.8%(-3.08)#1,043 | 4.9%(-2.16)#15,060 |
| 16. | 95817 | 2.6% | 5.8%(-3.16)#1,060 | 4.9%(-2.25)#15,347 |
| 17. | 95820 | 2.6% | 5.8%(-3.19)#1,068 | 4.9%(-2.27)#15,441 |
| 18. | 95830 | 2.6% | 5.8%(-3.23)#1,076 | 4.9%(-2.31)#15,581 |
| 19. | 95824 | 2.4% | 5.8%(-3.37)#1,115 | 4.9%(-2.45)#16,123 |
| 20. | 95816 | 2.3% | 5.8%(-3.49)#1,134 | 4.9%(-2.57)#16,527 |
| 21. | 95814 | 2.3% | 5.8%(-3.51)#1,139 | 4.9%(-2.59)#16,577 |
| 22. | 95825 | 2.3% | 5.8%(-3.52)#1,142 | 4.9%(-2.60)#16,620 |
| 23. | 95842 | 2.3% | 5.8%(-3.54)#1,149 | 4.9%(-2.62)#16,703 |
| 24. | 95864 | 2.1% | 5.8%(-3.67)#1,170 | 4.9%(-2.75)#17,167 |
| 25. | 95821 | 2.0% | 5.8%(-3.78)#1,181 | 4.9%(-2.86)#17,503 |
| 26. | 95832 | 2.0% | 5.8%(-3.86)#1,193 | 4.9%(-2.94)#17,767 |
| 27. | 95811 | 2.0% | 5.8%(-3.86)#1,196 | 4.9%(-2.94)#17,773 |
1
Common Questions
What are the Top 10 Zip Codes with the Highest Percentage of Population with a Degree in Computers and Mathematics in Sacramento, CA?
Top 10 Zip Codes with the Highest Percentage of Population with a Degree in Computers and Mathematics in Sacramento, CA are:
What zip code has the Highest Percentage of Population with a Degree in Computers and Mathematics in Sacramento, CA?
95827 has the Highest Percentage of Population with a Degree in Computers and Mathematics in Sacramento, CA with 7.0%.
What is the Percentage of Population with a Degree in Computers and Mathematics in Sacramento, CA?
Percentage of Population with a Degree in Computers and Mathematics in Sacramento is 3.6%.
What is the Percentage of Population with a Degree in Computers and Mathematics in California?
Percentage of Population with a Degree in Computers and Mathematics in California is 5.8%.
What is the Percentage of Population with a Degree in Computers and Mathematics in the United States?
Percentage of Population with a Degree in Computers and Mathematics in the United States is 4.9%.