Zip Codes with the Highest Percentage of Population Employed in Professional & Scientific Services in Moreno Valley, CA
RELATED REPORTS & OPTIONS
Professional & Scientific Services
Moreno Valley
Compare Zip Codes
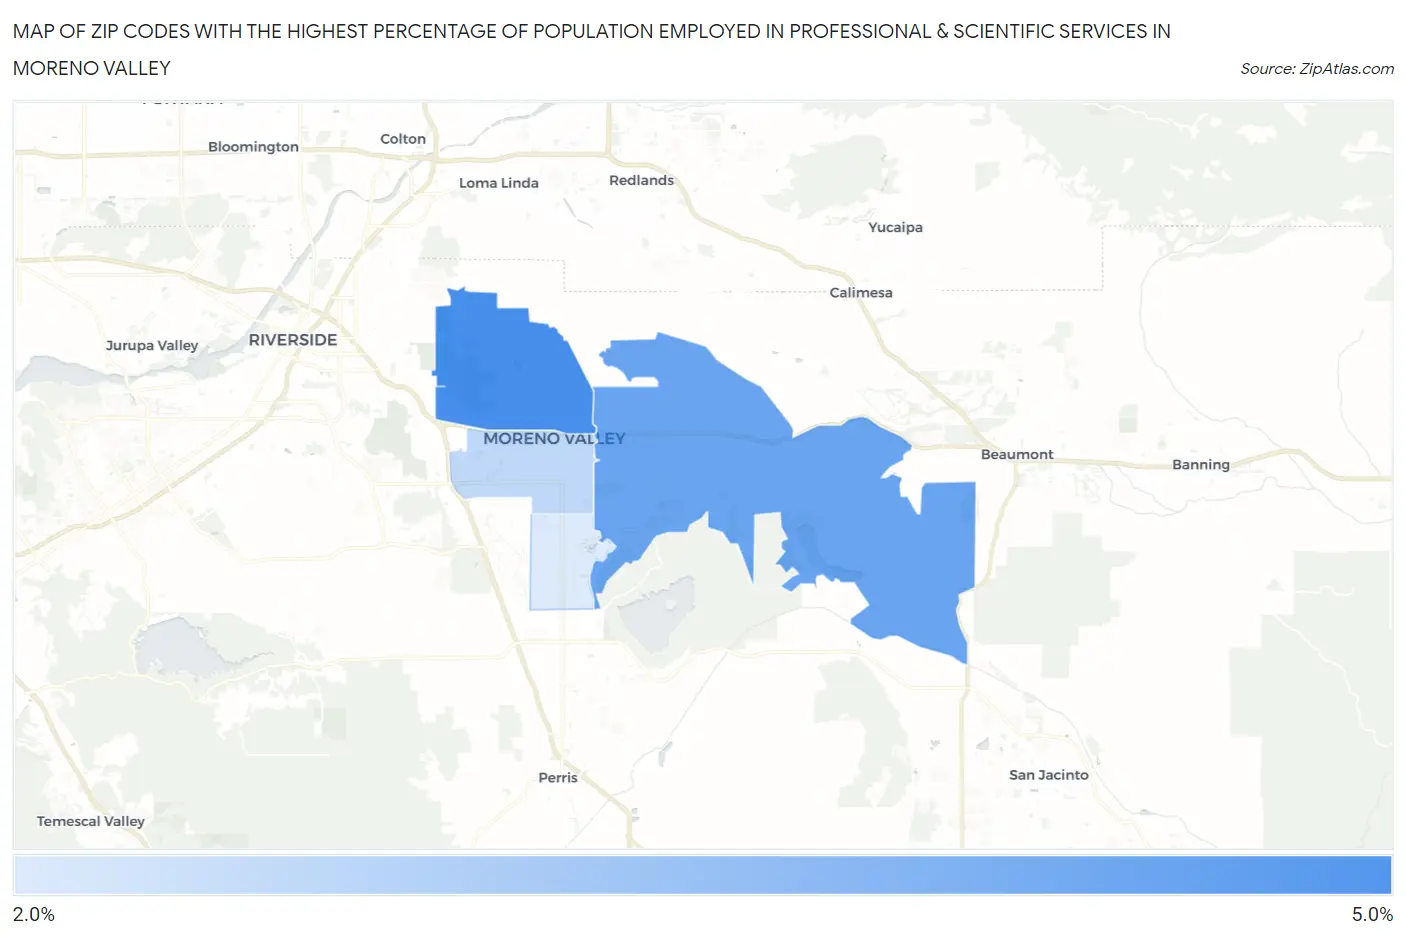
Map of Zip Codes with the Highest Percentage of Population Employed in Professional & Scientific Services in Moreno Valley
2.2%
4.2%
Zip Codes with the Highest Percentage of Population Employed in Professional & Scientific Services in Moreno Valley, CA
| Zip Code | % Employed | vs State | vs National | |
| 1. | 92557 | 4.2% | 9.4%(-5.24)#1,129 | 7.8%(-3.65)#14,534 |
| 2. | 92555 | 3.7% | 9.4%(-5.70)#1,176 | 7.8%(-4.11)#15,935 |
| 3. | 92553 | 2.6% | 9.4%(-6.82)#1,309 | 7.8%(-5.23)#19,782 |
| 4. | 92551 | 2.2% | 9.4%(-7.21)#1,362 | 7.8%(-5.62)#21,143 |
1
Common Questions
What are the Top 3 Zip Codes with the Highest Percentage of Population Employed in Professional & Scientific Services in Moreno Valley, CA?
Top 3 Zip Codes with the Highest Percentage of Population Employed in Professional & Scientific Services in Moreno Valley, CA are:
What zip code has the Highest Percentage of Population Employed in Professional & Scientific Services in Moreno Valley, CA?
92557 has the Highest Percentage of Population Employed in Professional & Scientific Services in Moreno Valley, CA with 4.2%.
What is the Percentage of Population Employed in Professional & Scientific Services in Moreno Valley, CA?
Percentage of Population Employed in Professional & Scientific Services in Moreno Valley is 3.2%.
What is the Percentage of Population Employed in Professional & Scientific Services in California?
Percentage of Population Employed in Professional & Scientific Services in California is 9.4%.
What is the Percentage of Population Employed in Professional & Scientific Services in the United States?
Percentage of Population Employed in Professional & Scientific Services in the United States is 7.8%.