Immigrants from Yemen vs Armenian 1 or more Vehicles in Household

COMPARE

Immigrants from Yemen
Race
Ancestry
AfghanAfricanAlaska NativeAlaskan AthabascanAlbanianAleutAlsatianAmericanApacheArabArapahoArgentineanAssyrian/Chaldean/SyriacAustralianAustrianBahamianBangladeshiBarbadianBasqueBelgianBelizeanBermudanBhutaneseBlackfeetBolivianBrazilianBritishBritish West IndianBulgarianBurmeseCajunCambodianCanadianCape VerdeanCarpatho RusynCelticCentral AmericanCentral American IndianCherokeeCheyenneChickasawChileanChineseChippewaChoctawColombianColvilleComancheCosta RicanCreeCreekCroatianCrowCubanCypriotCzechCzechoslovakianDanishDelawareDominicanDutchDutch West IndianEastern EuropeanEcuadorianEgyptianEnglishEstonianEthiopianEuropeanFijianFilipinoFinnishFrenchFrench American IndianFrench CanadianGermanGerman RussianGhanaianGreekGuamanian/ChamorroGuatemalanGuyaneseHaitianHmongHonduranHopiHoumaHungarianIcelanderIndian (Asian)IndonesianInupiatIranianIraqiIrishIroquoisIsraeliItalianJamaicanJapaneseJordanianKenyanKiowaKoreanLaotianLatvianLebaneseLiberianLithuanianLumbeeLuxembourgerMacedonianMalaysianMalteseMarshalleseMenomineeMexicanMexican American IndianMongolianMoroccanNative HawaiianNavajoNepaleseNew ZealanderNicaraguanNigerianNorthern EuropeanNorwegianOkinawanOsageOttawaPaiutePakistaniPalestinianPanamanianParaguayanPennsylvania GermanPeruvianPimaPolishPortuguesePotawatomiPuebloPuerto RicanPuget Sound SalishRomanianRussianSalvadoranSamoanScandinavianScotch-IrishScottishSeminoleSenegaleseSerbianShoshoneSierra LeoneanSiouxSlavicSlovakSloveneSomaliSouth AfricanSouth AmericanSouth American IndianSoviet UnionSpaniardSpanishSpanish AmericanSpanish American IndianSri LankanSubsaharan AfricanSudaneseSwedishSwissSyrianTaiwaneseThaiTlingit-HaidaTohono O'OdhamTonganTrinidadian and TobagonianTsimshianTurkishU.S. Virgin IslanderUgandanUkrainianUruguayanUteVenezuelanVietnameseWelshWest IndianYakamaYaquiYugoslavianYumanYup'ikZimbabwean
Immigration
NonimmigrantsImmigrantsAfghanistanAfricaAlbaniaArgentinaArmeniaAsiaAustraliaAustriaBahamasBangladeshBarbadosBelarusBelgiumBelizeBoliviaBosnia and HerzegovinaBrazilBulgariaBurma/MyanmarCabo VerdeCambodiaCameroonCanadaCaribbeanCentral AmericaChileChinaColombiaCongoCosta RicaCroatiaCubaCzechoslovakiaDenmarkDominicaDominican RepublicEastern AfricaEastern AsiaEastern EuropeEcuadorEgyptEl SalvadorEnglandEritreaEthiopiaEuropeFijiFranceGermanyGhanaGreeceGrenadaGuatemalaGuyanaHaitiHondurasHong KongHungaryIndiaIndonesiaIranIraqIrelandIsraelItalyJamaicaJapanJordanKazakhstanKenyaKoreaKuwaitLaosLatin AmericaLatviaLebanonLiberiaLithuaniaMalaysiaMexicoMicronesiaMiddle AfricaMoldovaMoroccoNepalNetherlandsNicaraguaNigeriaNorth AmericaNorth MacedoniaNorthern AfricaNorthern EuropeNorwayOceaniaPakistanPanamaPeruPhilippinesPolandPortugalRomaniaRussiaSaudi ArabiaScotlandSenegalSerbiaSierra LeoneSingaporeSomaliaSouth AfricaSouth AmericaSouth Central AsiaSouth Eastern AsiaSouthern EuropeSpainSri LankaSt. Vincent and the GrenadinesSudanSwedenSwitzerlandSyriaTaiwanThailandTrinidad and TobagoTurkeyUgandaUkraineUruguayUzbekistanVenezuelaVietnamWest IndiesWestern AfricaWestern AsiaWestern EuropeYemenZaireZimbabweAzores
Armenian
Race
Ancestry
AfghanAfricanAlaska NativeAlaskan AthabascanAlbanianAleutAlsatianAmericanApacheArabArapahoArgentineanArmenianAssyrian/Chaldean/SyriacAustralianAustrianBahamianBangladeshiBarbadianBasqueBelgianBelizeanBermudanBhutaneseBlackfeetBolivianBrazilianBritishBritish West IndianBulgarianBurmeseCajunCambodianCanadianCape VerdeanCarpatho RusynCelticCentral AmericanCentral American IndianCherokeeCheyenneChickasawChileanChineseChippewaChoctawColombianColvilleComancheCosta RicanCreeCreekCroatianCrowCubanCypriotCzechCzechoslovakianDanishDelawareDominicanDutchDutch West IndianEastern EuropeanEcuadorianEgyptianEnglishEstonianEthiopianEuropeanFijianFilipinoFinnishFrenchFrench American IndianFrench CanadianGermanGerman RussianGhanaianGreekGuamanian/ChamorroGuatemalanGuyaneseHaitianHmongHonduranHopiHoumaHungarianIcelanderIndian (Asian)IndonesianInupiatIranianIraqiIrishIroquoisIsraeliItalianJamaicanJapaneseJordanianKenyanKiowaKoreanLaotianLatvianLebaneseLiberianLithuanianLumbeeLuxembourgerMacedonianMalaysianMalteseMarshalleseMenomineeMexicanMexican American IndianMongolianMoroccanNative HawaiianNavajoNepaleseNew ZealanderNicaraguanNigerianNorthern EuropeanNorwegianOkinawanOsageOttawaPaiutePakistaniPalestinianPanamanianParaguayanPennsylvania GermanPeruvianPimaPolishPortuguesePotawatomiPuebloPuerto RicanPuget Sound SalishRomanianRussianSalvadoranSamoanScandinavianScotch-IrishScottishSeminoleSenegaleseSerbianShoshoneSierra LeoneanSiouxSlavicSlovakSloveneSomaliSouth AfricanSouth AmericanSouth American IndianSoviet UnionSpaniardSpanishSpanish AmericanSpanish American IndianSri LankanSubsaharan AfricanSudaneseSwedishSwissSyrianTaiwaneseThaiTlingit-HaidaTohono O'OdhamTonganTrinidadian and TobagonianTsimshianTurkishU.S. Virgin IslanderUgandanUkrainianUruguayanUteVenezuelanVietnameseWelshWest IndianYakamaYaquiYugoslavianYumanYup'ikZimbabwean
Immigration
NonimmigrantsImmigrantsAfghanistanAfricaAlbaniaArgentinaArmeniaAsiaAustraliaAustriaBahamasBangladeshBarbadosBelarusBelgiumBelizeBoliviaBosnia and HerzegovinaBrazilBulgariaBurma/MyanmarCabo VerdeCambodiaCameroonCanadaCaribbeanCentral AmericaChileChinaColombiaCongoCosta RicaCroatiaCubaCzechoslovakiaDenmarkDominicaDominican RepublicEastern AfricaEastern AsiaEastern EuropeEcuadorEgyptEl SalvadorEnglandEritreaEthiopiaEuropeFijiFranceGermanyGhanaGreeceGrenadaGuatemalaGuyanaHaitiHondurasHong KongHungaryIndiaIndonesiaIranIraqIrelandIsraelItalyJamaicaJapanJordanKazakhstanKenyaKoreaKuwaitLaosLatin AmericaLatviaLebanonLiberiaLithuaniaMalaysiaMexicoMicronesiaMiddle AfricaMoldovaMoroccoNepalNetherlandsNicaraguaNigeriaNorth AmericaNorth MacedoniaNorthern AfricaNorthern EuropeNorwayOceaniaPakistanPanamaPeruPhilippinesPolandPortugalRomaniaRussiaSaudi ArabiaScotlandSenegalSerbiaSierra LeoneSingaporeSomaliaSouth AfricaSouth AmericaSouth Central AsiaSouth Eastern AsiaSouthern EuropeSpainSri LankaSt. Vincent and the GrenadinesSudanSwedenSwitzerlandSyriaTaiwanThailandTrinidad and TobagoTurkeyUgandaUkraineUruguayUzbekistanVenezuelaVietnamWest IndiesWestern AfricaWestern AsiaWestern EuropeZaireZimbabweAzores
1 or more Vehicles in Household
Income
Poverty
Unemployment
Labor Participation
Family Structure
Vehicle Availability
Education Level
Disability

1 or more Vehicles in Household Comparison

Immigrants from Yemen

Armenians

Tragic
Exceptional
80.5%
1 OR MORE VEHICLES IN HOUSEHOLD
0.0/ 100
METRIC RATING
323rd/ 347
METRIC RANK
90.7%
1 OR MORE VEHICLES IN HOUSEHOLD
94.5/ 100
METRIC RATING
114th/ 347
METRIC RANK

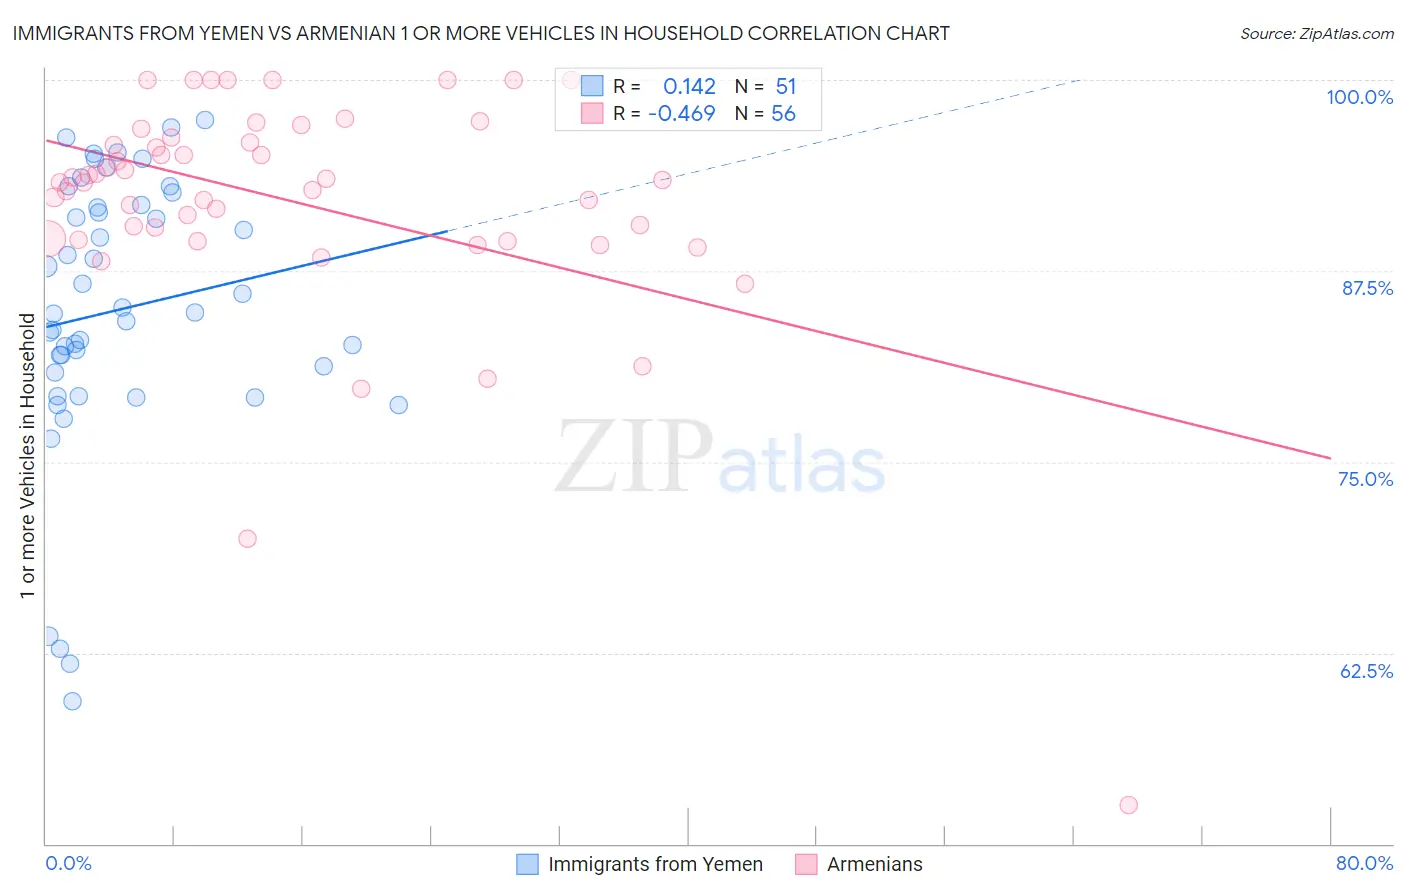
Immigrants from Yemen vs Armenian 1 or more Vehicles in Household Correlation Chart

The statistical analysis conducted on geographies consisting of 82,433,611 people shows a poor positive correlation between the proportion of Immigrants from Yemen and percentage of households with 1 or more vehicles available in the United States with a correlation coefficient (R) of 0.142 and weighted average of 80.5%. Similarly, the statistical analysis conducted on geographies consisting of 310,834,623 people shows a moderate negative correlation between the proportion of Armenians and percentage of households with 1 or more vehicles available in the United States with a correlation coefficient (R) of -0.469 and weighted average of 90.7%, a difference of 12.6%.
Immigrants from Yemen vs Armenian 1 or more Vehicles in Household

1 or more Vehicles in Household Correlation Summary

MeasurementImmigrants from YemenArmenian
Minimum59.3%52.6%
Maximum97.4%100.0%
Range38.1%47.4%
Mean85.0%92.0%
Median84.8%93.4%
Interquartile 25% (IQ1)80.8%89.6%
Interquartile 75% (IQ3)91.8%96.1%
Interquartile Range (IQR)11.0%6.5%
Standard Deviation (Sample)9.0%7.8%
Standard Deviation (Population)8.9%7.7%

Similar Demographics by 1 or more Vehicles in Household

Demographics Similar to Immigrants from Yemen by 1 or more Vehicles in Household

In terms of 1 or more vehicles in household, the demographic groups most similar to Immigrants from Yemen are Immigrants from Caribbean (80.4%, a difference of 0.11%), Senegalese (80.4%, a difference of 0.22%), Immigrants from West Indies (79.5%, a difference of 1.3%), Immigrants from Cabo Verde (81.6%, a difference of 1.3%), and Immigrants from Senegal (79.0%, a difference of 1.9%).
DemographicsRating | Rank1 or more Vehicles in Household
Alaska Natives
0.0
/100
|
#316
Tragic
83.8%
Ghanaians
0.0
/100
|
#317
Tragic
83.6%
Immigrants | Ghana
0.0
/100
|
#318
Tragic
83.4%
Immigrants | Belarus
0.0
/100
|
#319
Tragic
83.3%
Soviet Union
0.0
/100
|
#320
Tragic
82.7%
Jamaicans
0.0
/100
|
#321
Tragic
82.1%
Immigrants | Cabo Verde
0.0
/100
|
#322
Tragic
81.6%
Immigrants | Yemen
0.0
/100
|
#323
Tragic
80.5%
Immigrants | Caribbean
0.0
/100
|
#324
Tragic
80.4%
Senegalese
0.0
/100
|
#325
Tragic
80.4%
Immigrants | West Indies
0.0
/100
|
#326
Tragic
79.5%
Immigrants | Senegal
0.0
/100
|
#327
Tragic
79.0%
Ecuadorians
0.0
/100
|
#328
Tragic
77.9%
Immigrants | Dominica
0.0
/100
|
#329
Tragic
77.8%
Immigrants | Trinidad and Tobago
0.0
/100
|
#330
Tragic
76.8%

Demographics Similar to Armenians by 1 or more Vehicles in Household

In terms of 1 or more vehicles in household, the demographic groups most similar to Armenians are Immigrants from Kuwait (90.7%, a difference of 0.020%), Serbian (90.7%, a difference of 0.020%), Chippewa (90.7%, a difference of 0.020%), Greek (90.6%, a difference of 0.070%), and Japanese (90.6%, a difference of 0.080%).
DemographicsRating | Rank1 or more Vehicles in Household
Maltese
97.7
/100
|
#107
Exceptional
91.0%
Hispanics or Latinos
97.6
/100
|
#108
Exceptional
91.0%
Delaware
97.6
/100
|
#109
Exceptional
91.0%
Mexican American Indians
97.4
/100
|
#110
Exceptional
91.0%
Navajo
95.8
/100
|
#111
Exceptional
90.8%
Immigrants | Netherlands
95.7
/100
|
#112
Exceptional
90.8%
Immigrants | Kuwait
94.7
/100
|
#113
Exceptional
90.7%
Armenians
94.5
/100
|
#114
Exceptional
90.7%
Serbians
94.3
/100
|
#115
Exceptional
90.7%
Chippewa
94.3
/100
|
#116
Exceptional
90.7%
Greeks
93.5
/100
|
#117
Exceptional
90.6%
Japanese
93.4
/100
|
#118
Exceptional
90.6%
Blackfeet
92.6
/100
|
#119
Exceptional
90.6%
Immigrants | Thailand
92.3
/100
|
#120
Exceptional
90.6%
Icelanders
92.1
/100
|
#121
Exceptional
90.5%