Immigrants from Belize vs Brazilian 4 or more Vehicles in Household
COMPARE
Immigrants from Belize
Brazilian
4 or more Vehicles in Household
4 or more Vehicles in Household Comparison
Immigrants from Belize
Brazilians
6.1%
4 OR MORE VEHICLES IN HOUSEHOLD
19.8/ 100
METRIC RATING
204th/ 347
METRIC RANK
5.4%
4 OR MORE VEHICLES IN HOUSEHOLD
0.3/ 100
METRIC RATING
284th/ 347
METRIC RANK
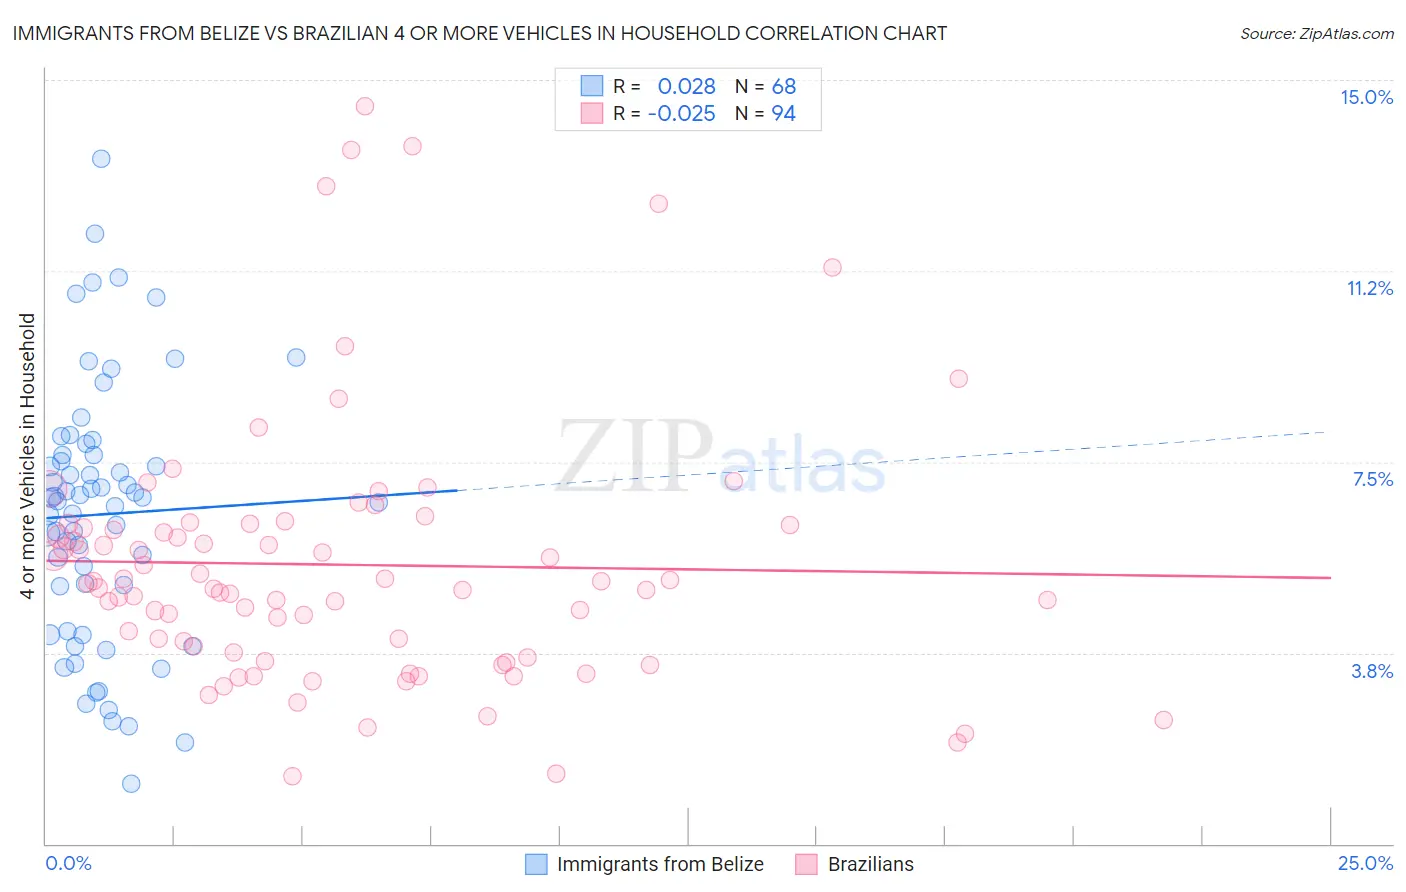
Immigrants from Belize vs Brazilian 4 or more Vehicles in Household Correlation Chart
The statistical analysis conducted on geographies consisting of 129,765,587 people shows no correlation between the proportion of Immigrants from Belize and percentage of households with 4 or more vehicles available in the United States with a correlation coefficient (R) of 0.028 and weighted average of 6.1%. Similarly, the statistical analysis conducted on geographies consisting of 322,327,740 people shows no correlation between the proportion of Brazilians and percentage of households with 4 or more vehicles available in the United States with a correlation coefficient (R) of -0.025 and weighted average of 5.4%, a difference of 13.5%.
4 or more Vehicles in Household Correlation Summary
| Measurement | Immigrants from Belize | Brazilian |
| Minimum | 1.2% | 1.3% |
| Maximum | 13.4% | 14.5% |
| Range | 12.3% | 13.2% |
| Mean | 6.5% | 5.5% |
| Median | 6.8% | 5.1% |
| Interquartile 25% (IQ1) | 4.6% | 3.7% |
| Interquartile 75% (IQ3) | 7.6% | 6.3% |
| Interquartile Range (IQR) | 3.0% | 2.5% |
| Standard Deviation (Sample) | 2.5% | 2.6% |
| Standard Deviation (Population) | 2.5% | 2.6% |
Similar Demographics by 4 or more Vehicles in Household
Demographics Similar to Immigrants from Belize by 4 or more Vehicles in Household
In terms of 4 or more vehicles in household, the demographic groups most similar to Immigrants from Belize are Honduran (6.1%, a difference of 0.090%), Immigrants from Sierra Leone (6.1%, a difference of 0.10%), Kenyan (6.1%, a difference of 0.23%), Immigrants from South Central Asia (6.1%, a difference of 0.24%), and Egyptian (6.1%, a difference of 0.25%).
| Demographics | Rating | Rank | 4 or more Vehicles in Household |
| Immigrants | Sri Lanka | 23.7 /100 | #197 | Fair 6.1% |
| Immigrants | Portugal | 22.3 /100 | #198 | Fair 6.1% |
| Immigrants | Norway | 21.8 /100 | #199 | Fair 6.1% |
| Latvians | 21.7 /100 | #200 | Fair 6.1% |
| Egyptians | 21.4 /100 | #201 | Fair 6.1% |
| Immigrants | South Central Asia | 21.3 /100 | #202 | Fair 6.1% |
| Immigrants | Sierra Leone | 20.5 /100 | #203 | Fair 6.1% |
| Immigrants | Belize | 19.8 /100 | #204 | Poor 6.1% |
| Hondurans | 19.3 /100 | #205 | Poor 6.1% |
| Kenyans | 18.5 /100 | #206 | Poor 6.1% |
| Immigrants | Chile | 16.9 /100 | #207 | Poor 6.1% |
| Immigrants | Nigeria | 15.6 /100 | #208 | Poor 6.1% |
| Immigrants | Honduras | 15.4 /100 | #209 | Poor 6.1% |
| Immigrants | Zimbabwe | 15.1 /100 | #210 | Poor 6.0% |
| Panamanians | 14.8 /100 | #211 | Poor 6.0% |
Demographics Similar to Brazilians by 4 or more Vehicles in Household
In terms of 4 or more vehicles in household, the demographic groups most similar to Brazilians are Immigrants from Ireland (5.4%, a difference of 0.29%), Immigrants from Liberia (5.4%, a difference of 0.34%), Immigrants from Spain (5.4%, a difference of 0.37%), Immigrants from Colombia (5.4%, a difference of 0.38%), and Immigrants from Croatia (5.4%, a difference of 0.47%).
| Demographics | Rating | Rank | 4 or more Vehicles in Household |
| Immigrants | Bulgaria | 0.5 /100 | #277 | Tragic 5.5% |
| Immigrants | Eastern Europe | 0.4 /100 | #278 | Tragic 5.4% |
| Immigrants | Uruguay | 0.3 /100 | #279 | Tragic 5.4% |
| Alsatians | 0.3 /100 | #280 | Tragic 5.4% |
| Immigrants | Western Africa | 0.3 /100 | #281 | Tragic 5.4% |
| Immigrants | Spain | 0.3 /100 | #282 | Tragic 5.4% |
| Immigrants | Ireland | 0.3 /100 | #283 | Tragic 5.4% |
| Brazilians | 0.3 /100 | #284 | Tragic 5.4% |
| Immigrants | Liberia | 0.2 /100 | #285 | Tragic 5.4% |
| Immigrants | Colombia | 0.2 /100 | #286 | Tragic 5.4% |
| Immigrants | Croatia | 0.2 /100 | #287 | Tragic 5.4% |
| Venezuelans | 0.2 /100 | #288 | Tragic 5.3% |
| Immigrants | Bosnia and Herzegovina | 0.2 /100 | #289 | Tragic 5.3% |
| Immigrants | Russia | 0.2 /100 | #290 | Tragic 5.3% |
| Immigrants | Bahamas | 0.1 /100 | #291 | Tragic 5.3% |