Immigrants from Africa vs Immigrants from Italy 1 or more Vehicles in Household

COMPARE

Immigrants from Africa
Race
Ancestry
AfghanAfricanAlaska NativeAlaskan AthabascanAlbanianAleutAlsatianAmericanApacheArabArapahoArgentineanArmenianAssyrian/Chaldean/SyriacAustralianAustrianBahamianBangladeshiBarbadianBasqueBelgianBelizeanBermudanBhutaneseBlackfeetBolivianBrazilianBritishBritish West IndianBulgarianBurmeseCajunCambodianCanadianCape VerdeanCarpatho RusynCelticCentral AmericanCentral American IndianCherokeeCheyenneChickasawChileanChineseChippewaChoctawColombianColvilleComancheCosta RicanCreeCreekCroatianCrowCubanCypriotCzechCzechoslovakianDanishDelawareDominicanDutchDutch West IndianEastern EuropeanEcuadorianEgyptianEnglishEstonianEthiopianEuropeanFijianFilipinoFinnishFrenchFrench American IndianFrench CanadianGermanGerman RussianGhanaianGreekGuamanian/ChamorroGuatemalanGuyaneseHaitianHmongHonduranHopiHoumaHungarianIcelanderIndian (Asian)IndonesianInupiatIranianIraqiIrishIroquoisIsraeliItalianJamaicanJapaneseJordanianKenyanKiowaKoreanLaotianLatvianLebaneseLiberianLithuanianLumbeeLuxembourgerMacedonianMalaysianMalteseMarshalleseMenomineeMexicanMexican American IndianMongolianMoroccanNative HawaiianNavajoNepaleseNew ZealanderNicaraguanNigerianNorthern EuropeanNorwegianOkinawanOsageOttawaPaiutePakistaniPalestinianPanamanianParaguayanPennsylvania GermanPeruvianPimaPolishPortuguesePotawatomiPuebloPuerto RicanPuget Sound SalishRomanianRussianSalvadoranSamoanScandinavianScotch-IrishScottishSeminoleSenegaleseSerbianShoshoneSierra LeoneanSiouxSlavicSlovakSloveneSomaliSouth AfricanSouth AmericanSouth American IndianSoviet UnionSpaniardSpanishSpanish AmericanSpanish American IndianSri LankanSubsaharan AfricanSudaneseSwedishSwissSyrianTaiwaneseThaiTlingit-HaidaTohono O'OdhamTonganTrinidadian and TobagonianTsimshianTurkishU.S. Virgin IslanderUgandanUkrainianUruguayanUteVenezuelanVietnameseWelshWest IndianYakamaYaquiYugoslavianYumanYup'ikZimbabwean
Immigration
NonimmigrantsImmigrantsAfghanistanAfricaAlbaniaArgentinaArmeniaAsiaAustraliaAustriaBahamasBangladeshBarbadosBelarusBelgiumBelizeBoliviaBosnia and HerzegovinaBrazilBulgariaBurma/MyanmarCabo VerdeCambodiaCameroonCanadaCaribbeanCentral AmericaChileChinaColombiaCongoCosta RicaCroatiaCubaCzechoslovakiaDenmarkDominicaDominican RepublicEastern AfricaEastern AsiaEastern EuropeEcuadorEgyptEl SalvadorEnglandEritreaEthiopiaEuropeFijiFranceGermanyGhanaGreeceGrenadaGuatemalaGuyanaHaitiHondurasHong KongHungaryIndiaIndonesiaIranIraqIrelandIsraelJamaicaJapanJordanKazakhstanKenyaKoreaKuwaitLaosLatin AmericaLatviaLebanonLiberiaLithuaniaMalaysiaMexicoMicronesiaMiddle AfricaMoldovaMoroccoNepalNetherlandsNicaraguaNigeriaNorth AmericaNorth MacedoniaNorthern AfricaNorthern EuropeNorwayOceaniaPakistanPanamaPeruPhilippinesPolandPortugalRomaniaRussiaSaudi ArabiaScotlandSenegalSerbiaSierra LeoneSingaporeSomaliaSouth AfricaSouth AmericaSouth Central AsiaSouth Eastern AsiaSouthern EuropeSpainSri LankaSt. Vincent and the GrenadinesSudanSwedenSwitzerlandSyriaTaiwanThailandTrinidad and TobagoTurkeyUgandaUkraineUruguayUzbekistanVenezuelaVietnamWest IndiesWestern AfricaWestern AsiaWestern EuropeYemenZaireZimbabweAzores
Immigrants from Italy
Race
Ancestry
AfghanAfricanAlaska NativeAlaskan AthabascanAlbanianAleutAlsatianAmericanApacheArabArapahoArgentineanArmenianAssyrian/Chaldean/SyriacAustralianAustrianBahamianBangladeshiBarbadianBasqueBelgianBelizeanBermudanBhutaneseBlackfeetBolivianBrazilianBritishBritish West IndianBulgarianBurmeseCajunCambodianCanadianCape VerdeanCarpatho RusynCelticCentral AmericanCentral American IndianCherokeeCheyenneChickasawChileanChineseChippewaChoctawColombianColvilleComancheCosta RicanCreeCreekCroatianCrowCubanCypriotCzechCzechoslovakianDanishDelawareDominicanDutchDutch West IndianEastern EuropeanEcuadorianEgyptianEnglishEstonianEthiopianEuropeanFijianFilipinoFinnishFrenchFrench American IndianFrench CanadianGermanGerman RussianGhanaianGreekGuamanian/ChamorroGuatemalanGuyaneseHaitianHmongHonduranHopiHoumaHungarianIcelanderIndian (Asian)IndonesianInupiatIranianIraqiIrishIroquoisIsraeliItalianJamaicanJapaneseJordanianKenyanKiowaKoreanLaotianLatvianLebaneseLiberianLithuanianLumbeeLuxembourgerMacedonianMalaysianMalteseMarshalleseMenomineeMexicanMexican American IndianMongolianMoroccanNative HawaiianNavajoNepaleseNew ZealanderNicaraguanNigerianNorthern EuropeanNorwegianOkinawanOsageOttawaPaiutePakistaniPalestinianPanamanianParaguayanPennsylvania GermanPeruvianPimaPolishPortuguesePotawatomiPuebloPuerto RicanPuget Sound SalishRomanianRussianSalvadoranSamoanScandinavianScotch-IrishScottishSeminoleSenegaleseSerbianShoshoneSierra LeoneanSiouxSlavicSlovakSloveneSomaliSouth AfricanSouth AmericanSouth American IndianSoviet UnionSpaniardSpanishSpanish AmericanSpanish American IndianSri LankanSubsaharan AfricanSudaneseSwedishSwissSyrianTaiwaneseThaiTlingit-HaidaTohono O'OdhamTonganTrinidadian and TobagonianTsimshianTurkishU.S. Virgin IslanderUgandanUkrainianUruguayanUteVenezuelanVietnameseWelshWest IndianYakamaYaquiYugoslavianYumanYup'ikZimbabwean
Immigration
NonimmigrantsImmigrantsAfghanistanAlbaniaArgentinaArmeniaAsiaAustraliaAustriaBahamasBangladeshBarbadosBelarusBelgiumBelizeBoliviaBosnia and HerzegovinaBrazilBulgariaBurma/MyanmarCabo VerdeCambodiaCameroonCanadaCaribbeanCentral AmericaChileChinaColombiaCongoCosta RicaCroatiaCubaCzechoslovakiaDenmarkDominicaDominican RepublicEastern AfricaEastern AsiaEastern EuropeEcuadorEgyptEl SalvadorEnglandEritreaEthiopiaEuropeFijiFranceGermanyGhanaGreeceGrenadaGuatemalaGuyanaHaitiHondurasHong KongHungaryIndiaIndonesiaIranIraqIrelandIsraelItalyJamaicaJapanJordanKazakhstanKenyaKoreaKuwaitLaosLatin AmericaLatviaLebanonLiberiaLithuaniaMalaysiaMexicoMicronesiaMiddle AfricaMoldovaMoroccoNepalNetherlandsNicaraguaNigeriaNorth AmericaNorth MacedoniaNorthern AfricaNorthern EuropeNorwayOceaniaPakistanPanamaPeruPhilippinesPolandPortugalRomaniaRussiaSaudi ArabiaScotlandSenegalSerbiaSierra LeoneSingaporeSomaliaSouth AfricaSouth AmericaSouth Central AsiaSouth Eastern AsiaSouthern EuropeSpainSri LankaSt. Vincent and the GrenadinesSudanSwedenSwitzerlandSyriaTaiwanThailandTrinidad and TobagoTurkeyUgandaUkraineUruguayUzbekistanVenezuelaVietnamWest IndiesWestern AfricaWestern AsiaWestern EuropeYemenZaireZimbabweAzores
1 or more Vehicles in Household
Income
Poverty
Unemployment
Labor Participation
Family Structure
Vehicle Availability
Education Level
Disability

1 or more Vehicles in Household Comparison

Immigrants from Africa

Immigrants from Italy

Tragic
Poor
87.6%
1 OR MORE VEHICLES IN HOUSEHOLD
0.2/ 100
METRIC RATING
269th/ 347
METRIC RANK
89.1%
1 OR MORE VEHICLES IN HOUSEHOLD
14.0/ 100
METRIC RATING
209th/ 347
METRIC RANK

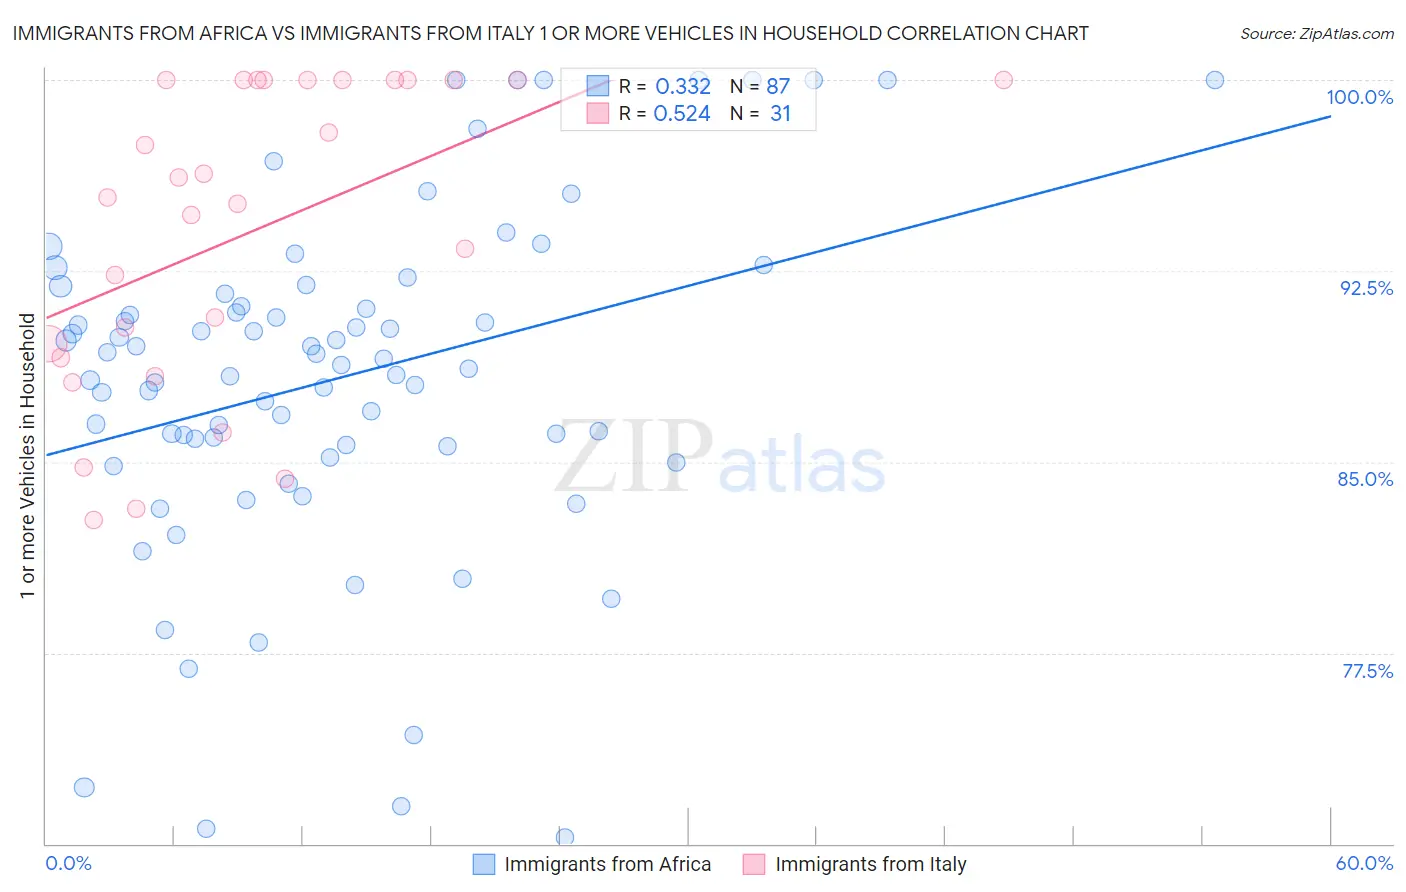
Immigrants from Africa vs Immigrants from Italy 1 or more Vehicles in Household Correlation Chart

The statistical analysis conducted on geographies consisting of 468,980,674 people shows a mild positive correlation between the proportion of Immigrants from Africa and percentage of households with 1 or more vehicles available in the United States with a correlation coefficient (R) of 0.332 and weighted average of 87.6%. Similarly, the statistical analysis conducted on geographies consisting of 324,164,676 people shows a substantial positive correlation between the proportion of Immigrants from Italy and percentage of households with 1 or more vehicles available in the United States with a correlation coefficient (R) of 0.524 and weighted average of 89.1%, a difference of 1.7%.
Immigrants from Africa vs Immigrants from Italy 1 or more Vehicles in Household

1 or more Vehicles in Household Correlation Summary

MeasurementImmigrants from AfricaImmigrants from Italy
Minimum70.3%82.7%
Maximum100.0%100.0%
Range29.7%17.3%
Mean88.3%94.1%
Median88.8%95.4%
Interquartile 25% (IQ1)85.6%89.1%
Interquartile 75% (IQ3)91.6%100.0%
Interquartile Range (IQR)6.0%10.9%
Standard Deviation (Sample)6.7%5.9%
Standard Deviation (Population)6.7%5.8%

Similar Demographics by 1 or more Vehicles in Household

Demographics Similar to Immigrants from Africa by 1 or more Vehicles in Household

In terms of 1 or more vehicles in household, the demographic groups most similar to Immigrants from Africa are Panamanian (87.5%, a difference of 0.010%), Bermudan (87.5%, a difference of 0.020%), Immigrants from Europe (87.6%, a difference of 0.050%), Immigrants from Colombia (87.6%, a difference of 0.080%), and Aleut (87.5%, a difference of 0.080%).
DemographicsRating | Rank1 or more Vehicles in Household
Sub-Saharan Africans
0.5
/100
|
#262
Tragic
87.9%
Immigrants | Egypt
0.5
/100
|
#263
Tragic
87.8%
Immigrants | Liberia
0.4
/100
|
#264
Tragic
87.8%
Africans
0.4
/100
|
#265
Tragic
87.8%
Israelis
0.3
/100
|
#266
Tragic
87.7%
Immigrants | Colombia
0.3
/100
|
#267
Tragic
87.6%
Immigrants | Europe
0.2
/100
|
#268
Tragic
87.6%
Immigrants | Africa
0.2
/100
|
#269
Tragic
87.6%
Panamanians
0.2
/100
|
#270
Tragic
87.5%
Bermudans
0.2
/100
|
#271
Tragic
87.5%
Aleuts
0.2
/100
|
#272
Tragic
87.5%
Immigrants | Northern Africa
0.2
/100
|
#273
Tragic
87.4%
Immigrants | Morocco
0.1
/100
|
#274
Tragic
87.4%
Immigrants | Singapore
0.1
/100
|
#275
Tragic
87.2%
Immigrants | France
0.1
/100
|
#276
Tragic
87.1%

Demographics Similar to Immigrants from Italy by 1 or more Vehicles in Household

In terms of 1 or more vehicles in household, the demographic groups most similar to Immigrants from Italy are Immigrants from Chile (89.1%, a difference of 0.010%), Dutch West Indian (89.0%, a difference of 0.020%), Immigrants from Denmark (89.1%, a difference of 0.030%), Sierra Leonean (89.0%, a difference of 0.030%), and Somali (89.0%, a difference of 0.040%).
DemographicsRating | Rank1 or more Vehicles in Household
Iroquois
19.8
/100
|
#202
Poor
89.2%
Cambodians
18.9
/100
|
#203
Poor
89.2%
Romanians
18.2
/100
|
#204
Poor
89.2%
Guatemalans
17.8
/100
|
#205
Poor
89.2%
Apache
16.2
/100
|
#206
Poor
89.1%
Immigrants | Denmark
14.8
/100
|
#207
Poor
89.1%
Immigrants | Chile
14.4
/100
|
#208
Poor
89.1%
Immigrants | Italy
14.0
/100
|
#209
Poor
89.1%
Dutch West Indians
13.5
/100
|
#210
Poor
89.0%
Sierra Leoneans
13.0
/100
|
#211
Poor
89.0%
Somalis
12.8
/100
|
#212
Poor
89.0%
Immigrants | Western Asia
12.3
/100
|
#213
Poor
89.0%
Immigrants | Hungary
11.9
/100
|
#214
Poor
89.0%
Immigrants | Sri Lanka
10.2
/100
|
#215
Poor
88.9%
Immigrants | Argentina
9.4
/100
|
#216
Tragic
88.9%