Costa Rican vs Pima 1 or more Vehicles in Household
COMPARE
Costa Rican
Pima
1 or more Vehicles in Household
1 or more Vehicles in Household Comparison
Costa Ricans
Pima
90.5%
1 OR MORE VEHICLES IN HOUSEHOLD
92.0/ 100
METRIC RATING
122nd/ 347
METRIC RANK
86.3%
1 OR MORE VEHICLES IN HOUSEHOLD
0.0/ 100
METRIC RATING
291st/ 347
METRIC RANK
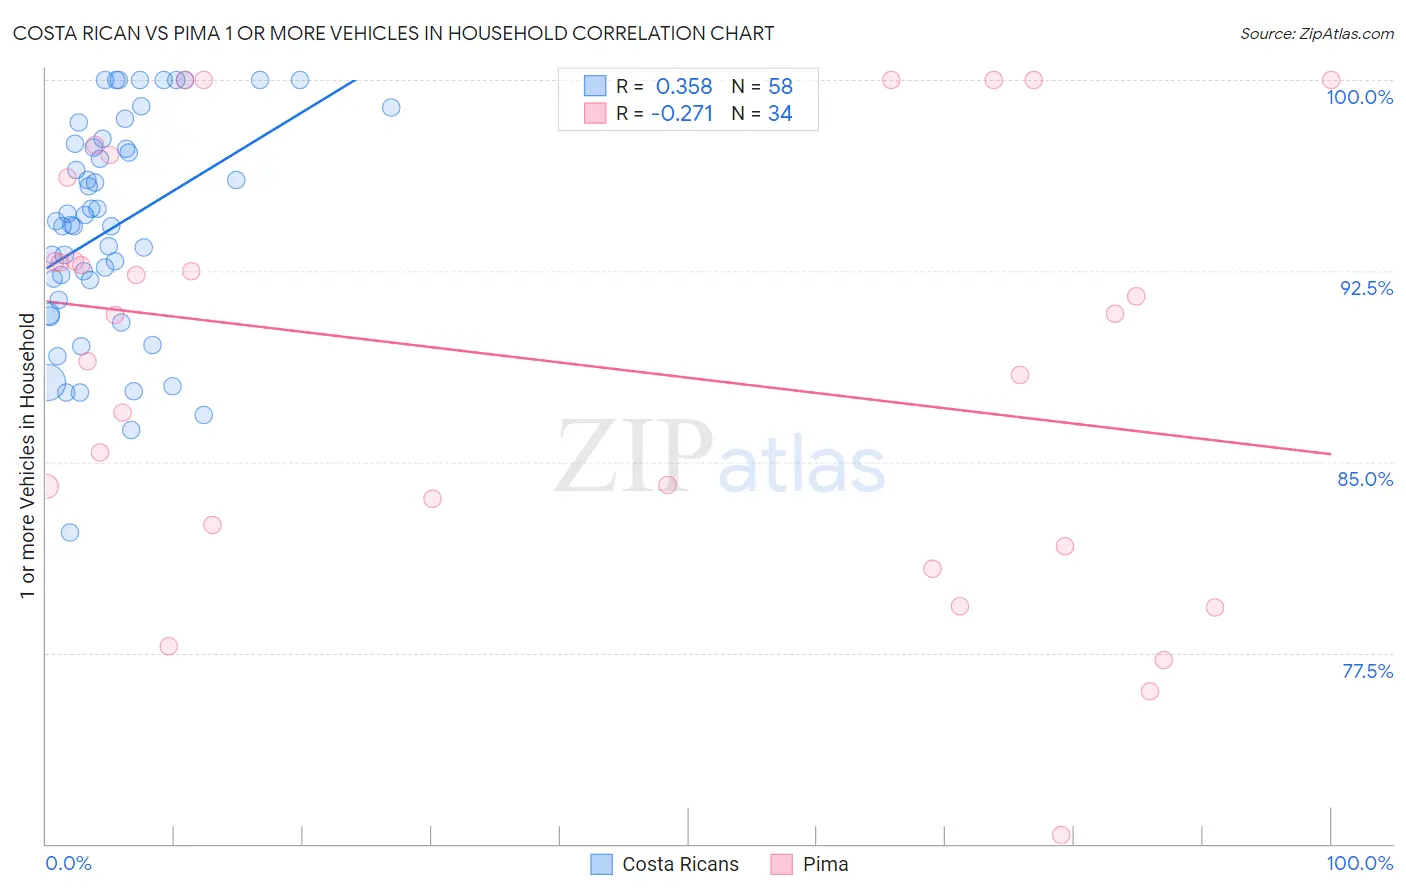
Costa Rican vs Pima 1 or more Vehicles in Household Correlation Chart
The statistical analysis conducted on geographies consisting of 253,487,388 people shows a mild positive correlation between the proportion of Costa Ricans and percentage of households with 1 or more vehicles available in the United States with a correlation coefficient (R) of 0.358 and weighted average of 90.5%. Similarly, the statistical analysis conducted on geographies consisting of 61,539,566 people shows a weak negative correlation between the proportion of Pima and percentage of households with 1 or more vehicles available in the United States with a correlation coefficient (R) of -0.271 and weighted average of 86.3%, a difference of 4.9%.
1 or more Vehicles in Household Correlation Summary
| Measurement | Costa Rican | Pima |
| Minimum | 82.2% | 70.4% |
| Maximum | 100.0% | 100.0% |
| Range | 17.8% | 29.6% |
| Mean | 94.2% | 89.0% |
| Median | 94.4% | 90.8% |
| Interquartile 25% (IQ1) | 91.3% | 82.5% |
| Interquartile 75% (IQ3) | 97.5% | 96.2% |
| Interquartile Range (IQR) | 6.2% | 13.6% |
| Standard Deviation (Sample) | 4.3% | 8.2% |
| Standard Deviation (Population) | 4.3% | 8.1% |
Similar Demographics by 1 or more Vehicles in Household
Demographics Similar to Costa Ricans by 1 or more Vehicles in Household
In terms of 1 or more vehicles in household, the demographic groups most similar to Costa Ricans are Icelander (90.5%, a difference of 0.010%), Fijian (90.5%, a difference of 0.010%), Immigrants from Thailand (90.6%, a difference of 0.020%), Puget Sound Salish (90.5%, a difference of 0.020%), and Blackfeet (90.6%, a difference of 0.030%).
| Demographics | Rating | Rank | 1 or more Vehicles in Household |
| Serbians | 94.3 /100 | #115 | Exceptional 90.7% |
| Chippewa | 94.3 /100 | #116 | Exceptional 90.7% |
| Greeks | 93.5 /100 | #117 | Exceptional 90.6% |
| Japanese | 93.4 /100 | #118 | Exceptional 90.6% |
| Blackfeet | 92.6 /100 | #119 | Exceptional 90.6% |
| Immigrants | Thailand | 92.3 /100 | #120 | Exceptional 90.6% |
| Icelanders | 92.1 /100 | #121 | Exceptional 90.5% |
| Costa Ricans | 92.0 /100 | #122 | Exceptional 90.5% |
| Fijians | 91.8 /100 | #123 | Exceptional 90.5% |
| Puget Sound Salish | 91.5 /100 | #124 | Exceptional 90.5% |
| Immigrants | Korea | 90.5 /100 | #125 | Exceptional 90.5% |
| Immigrants | Cameroon | 89.4 /100 | #126 | Excellent 90.4% |
| Immigrants | Azores | 89.1 /100 | #127 | Excellent 90.4% |
| Burmese | 89.0 /100 | #128 | Excellent 90.4% |
| Marshallese | 88.9 /100 | #129 | Excellent 90.4% |
Demographics Similar to Pima by 1 or more Vehicles in Household
In terms of 1 or more vehicles in household, the demographic groups most similar to Pima are Immigrants from Australia (86.4%, a difference of 0.080%), Immigrants from Ireland (86.4%, a difference of 0.12%), Hopi (86.4%, a difference of 0.14%), Immigrants from Malaysia (86.5%, a difference of 0.21%), and Okinawan (86.1%, a difference of 0.23%).
| Demographics | Rating | Rank | 1 or more Vehicles in Household |
| Central American Indians | 0.0 /100 | #284 | Tragic 86.7% |
| Immigrants | Kazakhstan | 0.0 /100 | #285 | Tragic 86.6% |
| Immigrants | Eastern Asia | 0.0 /100 | #286 | Tragic 86.5% |
| Immigrants | Malaysia | 0.0 /100 | #287 | Tragic 86.5% |
| Hopi | 0.0 /100 | #288 | Tragic 86.4% |
| Immigrants | Ireland | 0.0 /100 | #289 | Tragic 86.4% |
| Immigrants | Australia | 0.0 /100 | #290 | Tragic 86.4% |
| Pima | 0.0 /100 | #291 | Tragic 86.3% |
| Okinawans | 0.0 /100 | #292 | Tragic 86.1% |
| Indians (Asian) | 0.0 /100 | #293 | Tragic 86.0% |
| Alaskan Athabascans | 0.0 /100 | #294 | Tragic 86.0% |
| Immigrants | Jamaica | 0.0 /100 | #295 | Tragic 85.8% |
| Immigrants | Spain | 0.0 /100 | #296 | Tragic 85.8% |
| Paraguayans | 0.0 /100 | #297 | Tragic 85.7% |
| Belizeans | 0.0 /100 | #298 | Tragic 85.7% |