Apache vs Bangladeshi 1 or more Vehicles in Household

COMPARE

Apache
Race
Ancestry
AfghanAfricanAlaska NativeAlaskan AthabascanAlbanianAleutAlsatianAmericanApacheArabArapahoArgentineanArmenianAssyrian/Chaldean/SyriacAustralianAustrianBahamianBarbadianBasqueBelgianBelizeanBermudanBhutaneseBlackfeetBolivianBrazilianBritishBritish West IndianBulgarianBurmeseCajunCambodianCanadianCape VerdeanCarpatho RusynCelticCentral AmericanCentral American IndianCherokeeCheyenneChickasawChileanChineseChippewaChoctawColombianColvilleComancheCosta RicanCreeCreekCroatianCrowCubanCypriotCzechCzechoslovakianDanishDelawareDominicanDutchDutch West IndianEastern EuropeanEcuadorianEgyptianEnglishEstonianEthiopianEuropeanFijianFilipinoFinnishFrenchFrench American IndianFrench CanadianGermanGerman RussianGhanaianGreekGuamanian/ChamorroGuatemalanGuyaneseHaitianHmongHonduranHopiHoumaHungarianIcelanderIndian (Asian)IndonesianInupiatIranianIraqiIrishIroquoisIsraeliItalianJamaicanJapaneseJordanianKenyanKiowaKoreanLaotianLatvianLebaneseLiberianLithuanianLumbeeLuxembourgerMacedonianMalaysianMalteseMarshalleseMenomineeMexicanMexican American IndianMongolianMoroccanNative HawaiianNavajoNepaleseNew ZealanderNicaraguanNigerianNorthern EuropeanNorwegianOkinawanOsageOttawaPaiutePakistaniPalestinianPanamanianParaguayanPennsylvania GermanPeruvianPimaPolishPortuguesePotawatomiPuebloPuerto RicanPuget Sound SalishRomanianRussianSalvadoranSamoanScandinavianScotch-IrishScottishSeminoleSenegaleseSerbianShoshoneSierra LeoneanSiouxSlavicSlovakSloveneSomaliSouth AfricanSouth AmericanSouth American IndianSoviet UnionSpaniardSpanishSpanish AmericanSpanish American IndianSri LankanSubsaharan AfricanSudaneseSwedishSwissSyrianTaiwaneseThaiTlingit-HaidaTohono O'OdhamTonganTrinidadian and TobagonianTsimshianTurkishU.S. Virgin IslanderUgandanUkrainianUruguayanUteVenezuelanVietnameseWelshWest IndianYakamaYaquiYugoslavianYumanYup'ikZimbabwean
Immigration
NonimmigrantsImmigrantsAfghanistanAfricaAlbaniaArgentinaArmeniaAsiaAustraliaAustriaBahamasBangladeshBarbadosBelarusBelgiumBelizeBoliviaBosnia and HerzegovinaBrazilBulgariaBurma/MyanmarCabo VerdeCambodiaCameroonCanadaCaribbeanCentral AmericaChileChinaColombiaCongoCosta RicaCroatiaCubaCzechoslovakiaDenmarkDominicaDominican RepublicEastern AfricaEastern AsiaEastern EuropeEcuadorEgyptEl SalvadorEnglandEritreaEthiopiaEuropeFijiFranceGermanyGhanaGreeceGrenadaGuatemalaGuyanaHaitiHondurasHong KongHungaryIndiaIndonesiaIranIraqIrelandIsraelItalyJamaicaJapanJordanKazakhstanKenyaKoreaKuwaitLaosLatin AmericaLatviaLebanonLiberiaLithuaniaMalaysiaMexicoMicronesiaMiddle AfricaMoldovaMoroccoNepalNetherlandsNicaraguaNigeriaNorth AmericaNorth MacedoniaNorthern AfricaNorthern EuropeNorwayOceaniaPakistanPanamaPeruPhilippinesPolandPortugalRomaniaRussiaSaudi ArabiaScotlandSenegalSerbiaSierra LeoneSingaporeSomaliaSouth AfricaSouth AmericaSouth Central AsiaSouth Eastern AsiaSouthern EuropeSpainSri LankaSt. Vincent and the GrenadinesSudanSwedenSwitzerlandSyriaTaiwanThailandTrinidad and TobagoTurkeyUgandaUkraineUruguayUzbekistanVenezuelaVietnamWest IndiesWestern AfricaWestern AsiaWestern EuropeYemenZaireZimbabweAzores
Bangladeshi
Race
Ancestry
AfghanAfricanAlaska NativeAlaskan AthabascanAlbanianAleutAlsatianAmericanArabArapahoArgentineanArmenianAssyrian/Chaldean/SyriacAustralianAustrianBahamianBangladeshiBarbadianBasqueBelgianBelizeanBermudanBhutaneseBlackfeetBolivianBrazilianBritishBritish West IndianBulgarianBurmeseCajunCambodianCanadianCape VerdeanCarpatho RusynCelticCentral AmericanCentral American IndianCherokeeCheyenneChickasawChileanChineseChippewaChoctawColombianColvilleComancheCosta RicanCreeCreekCroatianCrowCubanCypriotCzechCzechoslovakianDanishDelawareDominicanDutchDutch West IndianEastern EuropeanEcuadorianEgyptianEnglishEstonianEthiopianEuropeanFijianFilipinoFinnishFrenchFrench American IndianFrench CanadianGermanGerman RussianGhanaianGreekGuamanian/ChamorroGuatemalanGuyaneseHaitianHmongHonduranHopiHoumaHungarianIcelanderIndian (Asian)IndonesianInupiatIranianIraqiIrishIroquoisIsraeliItalianJamaicanJapaneseJordanianKenyanKiowaKoreanLaotianLatvianLebaneseLiberianLithuanianLumbeeLuxembourgerMacedonianMalaysianMalteseMarshalleseMenomineeMexicanMexican American IndianMongolianMoroccanNative HawaiianNavajoNepaleseNew ZealanderNicaraguanNigerianNorthern EuropeanNorwegianOkinawanOsageOttawaPaiutePakistaniPalestinianPanamanianParaguayanPennsylvania GermanPeruvianPimaPolishPortuguesePotawatomiPuebloPuerto RicanPuget Sound SalishRomanianRussianSalvadoranSamoanScandinavianScotch-IrishScottishSeminoleSenegaleseSerbianShoshoneSierra LeoneanSiouxSlavicSlovakSloveneSomaliSouth AfricanSouth AmericanSouth American IndianSoviet UnionSpaniardSpanishSpanish AmericanSpanish American IndianSri LankanSubsaharan AfricanSudaneseSwedishSwissSyrianTaiwaneseThaiTlingit-HaidaTohono O'OdhamTonganTrinidadian and TobagonianTsimshianTurkishU.S. Virgin IslanderUgandanUkrainianUruguayanUteVenezuelanVietnameseWelshWest IndianYakamaYaquiYugoslavianYumanYup'ikZimbabwean
Immigration
NonimmigrantsImmigrantsAfghanistanAfricaAlbaniaArgentinaArmeniaAsiaAustraliaAustriaBahamasBangladeshBarbadosBelarusBelgiumBelizeBoliviaBosnia and HerzegovinaBrazilBulgariaBurma/MyanmarCabo VerdeCambodiaCameroonCanadaCaribbeanCentral AmericaChileChinaColombiaCongoCosta RicaCroatiaCubaCzechoslovakiaDenmarkDominicaDominican RepublicEastern AfricaEastern AsiaEastern EuropeEcuadorEgyptEl SalvadorEnglandEritreaEthiopiaEuropeFijiFranceGermanyGhanaGreeceGrenadaGuatemalaGuyanaHaitiHondurasHong KongHungaryIndiaIndonesiaIranIraqIrelandIsraelItalyJamaicaJapanJordanKazakhstanKenyaKoreaKuwaitLaosLatin AmericaLatviaLebanonLiberiaLithuaniaMalaysiaMexicoMicronesiaMiddle AfricaMoldovaMoroccoNepalNetherlandsNicaraguaNigeriaNorth AmericaNorth MacedoniaNorthern AfricaNorthern EuropeNorwayOceaniaPakistanPanamaPeruPhilippinesPolandPortugalRomaniaRussiaSaudi ArabiaScotlandSenegalSerbiaSierra LeoneSingaporeSomaliaSouth AfricaSouth AmericaSouth Central AsiaSouth Eastern AsiaSouthern EuropeSpainSri LankaSt. Vincent and the GrenadinesSudanSwedenSwitzerlandSyriaTaiwanThailandTrinidad and TobagoTurkeyUgandaUkraineUruguayUzbekistanVenezuelaVietnamWest IndiesWestern AfricaWestern AsiaWestern EuropeYemenZaireZimbabweAzores
1 or more Vehicles in Household
Income
Poverty
Unemployment
Labor Participation
Family Structure
Vehicle Availability
Education Level
Disability

1 or more Vehicles in Household Comparison

Apache

Bangladeshis

Poor
Exceptional
89.1%
1 OR MORE VEHICLES IN HOUSEHOLD
16.2/ 100
METRIC RATING
206th/ 347
METRIC RANK
91.4%
1 OR MORE VEHICLES IN HOUSEHOLD
99.2/ 100
METRIC RATING
89th/ 347
METRIC RANK

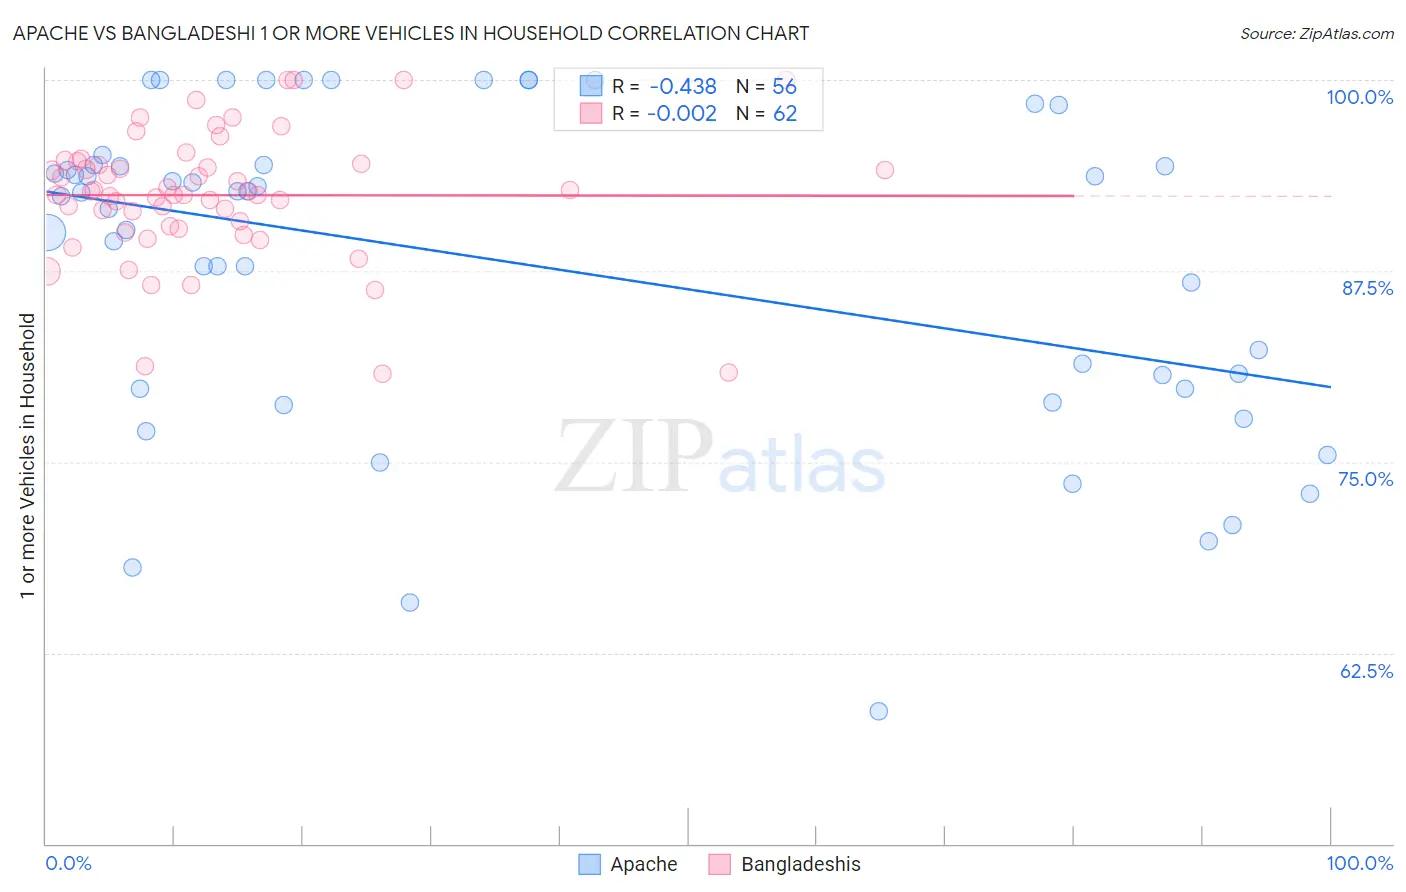
Apache vs Bangladeshi 1 or more Vehicles in Household Correlation Chart

The statistical analysis conducted on geographies consisting of 231,048,129 people shows a moderate negative correlation between the proportion of Apache and percentage of households with 1 or more vehicles available in the United States with a correlation coefficient (R) of -0.438 and weighted average of 89.1%. Similarly, the statistical analysis conducted on geographies consisting of 141,361,437 people shows no correlation between the proportion of Bangladeshis and percentage of households with 1 or more vehicles available in the United States with a correlation coefficient (R) of -0.002 and weighted average of 91.4%, a difference of 2.5%.
Apache vs Bangladeshi 1 or more Vehicles in Household

1 or more Vehicles in Household Correlation Summary

MeasurementApacheBangladeshi
Minimum58.7%80.7%
Maximum100.0%100.0%
Range41.3%19.3%
Mean88.0%92.5%
Median92.5%92.6%
Interquartile 25% (IQ1)79.8%90.4%
Interquartile 75% (IQ3)94.4%94.5%
Interquartile Range (IQR)14.6%4.1%
Standard Deviation (Sample)10.5%4.2%
Standard Deviation (Population)10.4%4.2%

Similar Demographics by 1 or more Vehicles in Household

Demographics Similar to Apache by 1 or more Vehicles in Household

In terms of 1 or more vehicles in household, the demographic groups most similar to Apache are Immigrants from Denmark (89.1%, a difference of 0.040%), Guatemalan (89.2%, a difference of 0.050%), Immigrants from Chile (89.1%, a difference of 0.050%), Romanian (89.2%, a difference of 0.060%), and Immigrants from Italy (89.1%, a difference of 0.070%).
DemographicsRating | Rank1 or more Vehicles in Household
Immigrants | Asia
22.8
/100
|
#199
Fair
89.3%
Central Americans
21.4
/100
|
#200
Fair
89.2%
Immigrants | Western Europe
20.5
/100
|
#201
Fair
89.2%
Iroquois
19.8
/100
|
#202
Poor
89.2%
Cambodians
18.9
/100
|
#203
Poor
89.2%
Romanians
18.2
/100
|
#204
Poor
89.2%
Guatemalans
17.8
/100
|
#205
Poor
89.2%
Apache
16.2
/100
|
#206
Poor
89.1%
Immigrants | Denmark
14.8
/100
|
#207
Poor
89.1%
Immigrants | Chile
14.4
/100
|
#208
Poor
89.1%
Immigrants | Italy
14.0
/100
|
#209
Poor
89.1%
Dutch West Indians
13.5
/100
|
#210
Poor
89.0%
Sierra Leoneans
13.0
/100
|
#211
Poor
89.0%
Somalis
12.8
/100
|
#212
Poor
89.0%
Immigrants | Western Asia
12.3
/100
|
#213
Poor
89.0%

Demographics Similar to Bangladeshis by 1 or more Vehicles in Household

In terms of 1 or more vehicles in household, the demographic groups most similar to Bangladeshis are Spanish American (91.4%, a difference of 0.0%), Immigrants from Canada (91.4%, a difference of 0.0%), Immigrants from Jordan (91.4%, a difference of 0.0%), Osage (91.4%, a difference of 0.010%), and Immigrants from Germany (91.4%, a difference of 0.010%).
DemographicsRating | Rank1 or more Vehicles in Household
Lebanese
99.3
/100
|
#82
Exceptional
91.4%
Immigrants | England
99.3
/100
|
#83
Exceptional
91.4%
Jordanians
99.3
/100
|
#84
Exceptional
91.4%
Tsimshian
99.3
/100
|
#85
Exceptional
91.4%
Osage
99.2
/100
|
#86
Exceptional
91.4%
Immigrants | Germany
99.2
/100
|
#87
Exceptional
91.4%
Spanish Americans
99.2
/100
|
#88
Exceptional
91.4%
Bangladeshis
99.2
/100
|
#89
Exceptional
91.4%
Immigrants | Canada
99.2
/100
|
#90
Exceptional
91.4%
Immigrants | Jordan
99.2
/100
|
#91
Exceptional
91.4%
Bhutanese
99.2
/100
|
#92
Exceptional
91.4%
Immigrants | North America
99.2
/100
|
#93
Exceptional
91.4%
Immigrants | Cuba
99.1
/100
|
#94
Exceptional
91.3%
Austrians
99.0
/100
|
#95
Exceptional
91.3%
Potawatomi
99.0
/100
|
#96
Exceptional
91.3%