Black/African American Female Unemployment
COMPARE
Black/African American
Select to Compare
Female Unemployment
Black/African American Female Unemployment
6.5%
UNEMPLOYMENT | FEMALES
0.0/ 100
METRIC RATING
321st/ 347
METRIC RANK
Black/African American Female Unemployment Correlation Chart
The statistical analysis conducted on geographies consisting of 554,894,161 people shows a very strong positive correlation between the proportion of Blacks/African Americans and unemploymnet rate among females in the United States with a correlation coefficient (R) of 0.816 and weighted average of 6.5%. On average, for every 1% (one percent) increase in Blacks/African Americans within a typical geography, there is an increase of 0.073% in unemploymnet rate among females.
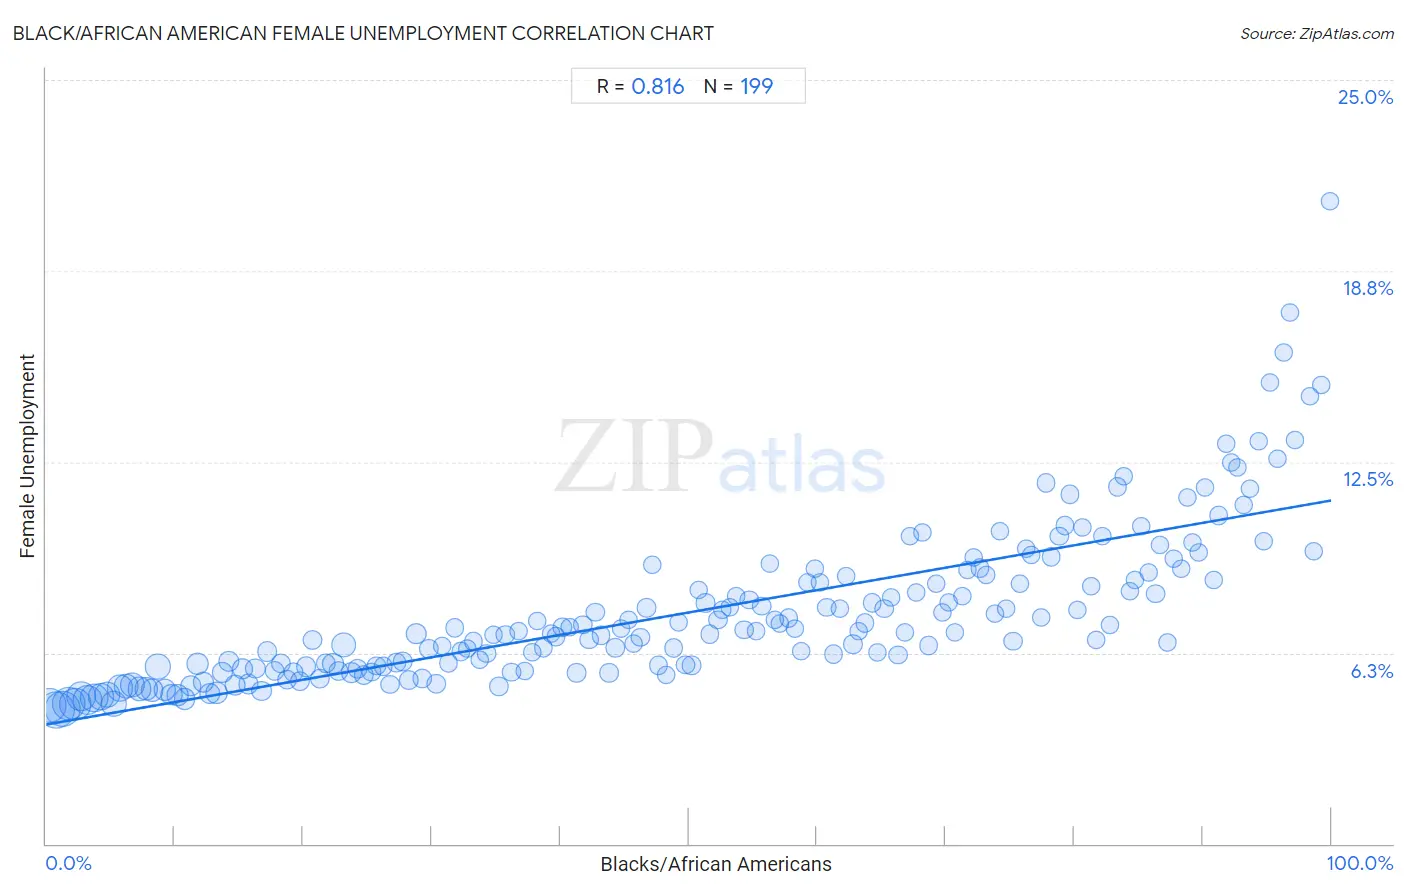
It is essential to understand that the correlation between the percentage of Blacks/African Americans and unemploymnet rate among females does not imply a direct cause-and-effect relationship. It remains uncertain whether the presence of Blacks/African Americans influences an upward or downward trend in the level of unemploymnet rate among females within an area, or if Blacks/African Americans simply ended up residing in those areas with higher or lower levels of unemploymnet rate among females due to other factors.
Demographics Similar to Blacks/African Americans by Female Unemployment
In terms of female unemployment, the demographic groups most similar to Blacks/African Americans are Vietnamese (6.5%, a difference of 0.080%), Immigrants from Belize (6.5%, a difference of 0.18%), Immigrants from Dominica (6.5%, a difference of 0.54%), Immigrants from Bangladesh (6.5%, a difference of 0.55%), and British West Indian (6.4%, a difference of 0.74%).
| Demographics | Rating | Rank | Female Unemployment |
| Immigrants from Ecuador | 0.0 /100 | #314 | Tragic 6.4% |
| Pueblo | 0.0 /100 | #315 | Tragic 6.4% |
| Houma | 0.0 /100 | #316 | Tragic 6.4% |
| Immigrants from St. Vincent and the Grenadines | 0.0 /100 | #317 | Tragic 6.4% |
| British West Indians | 0.0 /100 | #318 | Tragic 6.4% |
| Immigrants from Bangladesh | 0.0 /100 | #319 | Tragic 6.5% |
| Immigrants from Dominica | 0.0 /100 | #320 | Tragic 6.5% |
| Blacks/African Americans | 0.0 /100 | #321 | Tragic 6.5% |
| Vietnamese | 0.0 /100 | #322 | Tragic 6.5% |
| Immigrants from Belize | 0.0 /100 | #323 | Tragic 6.5% |
| Cheyenne | 0.0 /100 | #324 | Tragic 6.6% |
| Apache | 0.0 /100 | #325 | Tragic 6.6% |
| Natives/Alaskans | 0.0 /100 | #326 | Tragic 6.6% |
| Alaska Natives | 0.0 /100 | #327 | Tragic 6.6% |
| Guyanese | 0.0 /100 | #328 | Tragic 6.7% |
Black/African American Female Unemployment Correlation Summary
| Measurement | Black/African American Data | Female Unemployment Data |
| Minimum | 0.26% | 4.4% |
| Maximum | 99.9% | 21.0% |
| Range | 99.7% | 16.6% |
| Mean | 49.8% | 7.6% |
| Median | 49.7% | 6.9% |
| Interquartile 25% (IQ1) | 24.7% | 5.7% |
| Interquartile 75% (IQ3) | 74.7% | 8.6% |
| Interquartile Range (IQR) | 49.9% | 2.9% |
| Standard Deviation (Sample) | 28.8% | 2.6% |
| Standard Deviation (Population) | 28.7% | 2.6% |
Correlation Details
| Black/African American Percentile | Sample Size | Female Unemployment |
[ 0.0% - 0.5% ] 0.26% | 28,108,195 | 4.5% |
[ 0.5% - 1.0% ] 0.74% | 33,954,000 | 4.4% |
[ 1.0% - 1.5% ] 1.23% | 31,440,503 | 4.4% |
[ 1.5% - 2.0% ] 1.74% | 27,378,379 | 4.6% |
[ 2.0% - 2.5% ] 2.24% | 23,883,222 | 4.6% |
[ 2.5% - 3.0% ] 2.75% | 20,405,995 | 4.8% |
[ 3.0% - 3.5% ] 3.25% | 20,410,595 | 4.7% |
[ 3.5% - 4.0% ] 3.74% | 16,596,417 | 4.8% |
[ 4.0% - 4.5% ] 4.25% | 14,401,318 | 4.8% |
[ 4.5% - 5.0% ] 4.74% | 14,753,309 | 4.9% |
[ 5.0% - 5.5% ] 5.24% | 13,412,294 | 4.6% |
[ 5.5% - 6.0% ] 5.76% | 13,692,512 | 5.1% |
[ 6.0% - 6.5% ] 6.23% | 11,676,985 | 5.2% |
[ 6.5% - 7.0% ] 6.72% | 11,639,511 | 5.2% |
[ 7.0% - 7.5% ] 7.26% | 10,851,930 | 5.1% |
[ 7.5% - 8.0% ] 7.75% | 9,007,189 | 5.1% |
[ 8.0% - 8.5% ] 8.24% | 8,194,987 | 5.0% |
[ 8.5% - 9.0% ] 8.69% | 12,318,004 | 5.8% |
[ 9.0% - 9.5% ] 9.24% | 7,538,522 | 5.0% |
[ 9.5% - 10.0% ] 9.75% | 5,851,170 | 4.9% |
[ 10.0% - 10.5% ] 10.26% | 6,377,734 | 4.9% |
[ 10.5% - 11.0% ] 10.76% | 5,996,226 | 4.7% |
[ 11.0% - 11.5% ] 11.27% | 5,963,950 | 5.2% |
[ 11.5% - 12.0% ] 11.75% | 6,581,109 | 5.9% |
[ 12.0% - 12.5% ] 12.24% | 5,794,241 | 5.3% |
[ 12.5% - 13.0% ] 12.73% | 5,174,300 | 4.9% |
[ 13.0% - 13.5% ] 13.26% | 5,564,881 | 4.9% |
[ 13.5% - 14.0% ] 13.72% | 4,954,898 | 5.6% |
[ 14.0% - 14.5% ] 14.22% | 4,335,751 | 6.0% |
[ 14.5% - 15.0% ] 14.73% | 4,135,622 | 5.2% |
[ 15.0% - 15.5% ] 15.25% | 4,362,106 | 5.7% |
[ 15.5% - 16.0% ] 15.75% | 3,551,847 | 5.2% |
[ 16.0% - 16.5% ] 16.25% | 3,235,862 | 5.7% |
[ 16.5% - 17.0% ] 16.75% | 3,358,294 | 5.0% |
[ 17.0% - 17.5% ] 17.21% | 3,457,450 | 6.3% |
[ 17.5% - 18.0% ] 17.77% | 3,643,188 | 5.7% |
[ 18.0% - 18.5% ] 18.26% | 3,555,651 | 5.9% |
[ 18.5% - 19.0% ] 18.73% | 3,640,136 | 5.4% |
[ 19.0% - 19.5% ] 19.23% | 3,018,791 | 5.6% |
[ 19.5% - 20.0% ] 19.75% | 2,525,556 | 5.3% |
[ 20.0% - 20.5% ] 20.23% | 2,743,049 | 5.8% |
[ 20.5% - 21.0% ] 20.77% | 2,338,319 | 6.7% |
[ 21.0% - 21.5% ] 21.29% | 2,706,631 | 5.4% |
[ 21.5% - 22.0% ] 21.77% | 3,727,453 | 5.9% |
[ 22.0% - 22.5% ] 22.31% | 4,842,569 | 5.9% |
[ 22.5% - 23.0% ] 22.72% | 3,012,227 | 5.6% |
[ 23.0% - 23.5% ] 23.15% | 11,591,432 | 6.5% |
[ 23.5% - 24.0% ] 23.75% | 3,949,837 | 5.6% |
[ 24.0% - 24.5% ] 24.22% | 2,181,796 | 5.7% |
[ 24.5% - 25.0% ] 24.74% | 1,974,569 | 5.5% |
[ 25.0% - 25.5% ] 25.28% | 1,557,280 | 5.6% |
[ 25.5% - 26.0% ] 25.71% | 1,450,823 | 5.8% |
[ 26.0% - 26.5% ] 26.22% | 1,894,847 | 5.8% |
[ 26.5% - 27.0% ] 26.77% | 2,120,205 | 5.2% |
[ 27.0% - 27.5% ] 27.23% | 1,768,327 | 5.9% |
[ 27.5% - 28.0% ] 27.75% | 1,483,471 | 6.0% |
[ 28.0% - 28.5% ] 28.22% | 1,979,346 | 5.4% |
[ 28.5% - 29.0% ] 28.80% | 4,728,680 | 6.9% |
[ 29.0% - 29.5% ] 29.24% | 3,230,022 | 5.4% |
[ 29.5% - 30.0% ] 29.77% | 1,865,505 | 6.4% |
[ 30.0% - 30.5% ] 30.35% | 2,231,311 | 5.2% |
[ 30.5% - 31.0% ] 30.81% | 1,185,883 | 6.5% |
[ 31.0% - 31.5% ] 31.29% | 955,246 | 5.9% |
[ 31.5% - 32.0% ] 31.80% | 1,010,410 | 7.1% |
[ 32.0% - 32.5% ] 32.27% | 1,270,149 | 6.3% |
[ 32.5% - 33.0% ] 32.74% | 718,792 | 6.4% |
[ 33.0% - 33.5% ] 33.25% | 1,232,604 | 6.6% |
[ 33.5% - 34.0% ] 33.75% | 907,725 | 6.0% |
[ 34.0% - 34.5% ] 34.28% | 833,116 | 6.2% |
[ 34.5% - 35.0% ] 34.80% | 913,975 | 6.8% |
[ 35.0% - 35.5% ] 35.24% | 1,758,075 | 5.1% |
[ 35.5% - 36.0% ] 35.74% | 1,277,104 | 6.8% |
[ 36.0% - 36.5% ] 36.23% | 1,181,276 | 5.6% |
[ 36.5% - 37.0% ] 36.75% | 553,958 | 6.9% |
[ 37.0% - 37.5% ] 37.25% | 913,185 | 5.7% |
[ 37.5% - 38.0% ] 37.80% | 826,946 | 6.3% |
[ 38.0% - 38.5% ] 38.19% | 945,746 | 7.3% |
[ 38.5% - 39.0% ] 38.70% | 1,434,615 | 6.4% |
[ 39.0% - 39.5% ] 39.31% | 517,716 | 6.9% |
[ 39.5% - 40.0% ] 39.68% | 903,290 | 6.8% |
[ 40.0% - 40.5% ] 40.16% | 2,709,444 | 7.1% |
[ 40.5% - 41.0% ] 40.73% | 1,174,239 | 7.1% |
[ 41.0% - 41.5% ] 41.26% | 1,008,508 | 5.6% |
[ 41.5% - 42.0% ] 41.76% | 952,552 | 7.2% |
[ 42.0% - 42.5% ] 42.25% | 877,116 | 6.7% |
[ 42.5% - 43.0% ] 42.73% | 1,002,747 | 7.6% |
[ 43.0% - 43.5% ] 43.19% | 1,006,921 | 6.8% |
[ 43.5% - 44.0% ] 43.82% | 981,300 | 5.6% |
[ 44.0% - 44.5% ] 44.29% | 1,172,373 | 6.4% |
[ 44.5% - 45.0% ] 44.74% | 673,238 | 7.1% |
[ 45.0% - 45.5% ] 45.34% | 690,742 | 7.3% |
[ 45.5% - 46.0% ] 45.74% | 593,637 | 6.6% |
[ 46.0% - 46.5% ] 46.24% | 742,568 | 6.8% |
[ 46.5% - 47.0% ] 46.72% | 1,068,646 | 7.7% |
[ 47.0% - 47.5% ] 47.16% | 735,442 | 9.1% |
[ 47.5% - 48.0% ] 47.64% | 1,062,294 | 5.8% |
[ 48.0% - 48.5% ] 48.26% | 302,533 | 5.5% |
[ 48.5% - 49.0% ] 48.84% | 486,055 | 6.4% |
[ 49.0% - 49.5% ] 49.22% | 474,796 | 7.2% |
[ 49.5% - 50.0% ] 49.74% | 544,072 | 5.8% |
[ 50.0% - 50.5% ] 50.24% | 933,683 | 5.8% |
[ 50.5% - 51.0% ] 50.77% | 196,162 | 8.3% |
[ 51.0% - 51.5% ] 51.29% | 567,461 | 7.9% |
[ 51.5% - 52.0% ] 51.63% | 659,813 | 6.9% |
[ 52.0% - 52.5% ] 52.28% | 531,373 | 7.3% |
[ 52.5% - 53.0% ] 52.63% | 669,774 | 7.6% |
[ 53.0% - 53.5% ] 53.22% | 695,623 | 7.7% |
[ 53.5% - 54.0% ] 53.72% | 381,111 | 8.1% |
[ 54.0% - 54.5% ] 54.32% | 680,881 | 7.0% |
[ 54.5% - 55.0% ] 54.71% | 354,276 | 8.0% |
[ 55.0% - 55.5% ] 55.28% | 444,568 | 6.9% |
[ 55.5% - 56.0% ] 55.69% | 466,339 | 7.8% |
[ 56.0% - 56.5% ] 56.31% | 557,070 | 9.2% |
[ 56.5% - 57.0% ] 56.67% | 506,143 | 7.3% |
[ 57.0% - 57.5% ] 57.10% | 683,384 | 7.2% |
[ 57.5% - 58.0% ] 57.77% | 315,837 | 7.4% |
[ 58.0% - 58.5% ] 58.25% | 357,227 | 7.0% |
[ 58.5% - 59.0% ] 58.76% | 277,108 | 6.3% |
[ 59.0% - 59.5% ] 59.21% | 335,055 | 8.6% |
[ 59.5% - 60.0% ] 59.79% | 357,854 | 9.0% |
[ 60.0% - 60.5% ] 60.22% | 268,332 | 8.5% |
[ 60.5% - 61.0% ] 60.74% | 453,710 | 7.8% |
[ 61.0% - 61.5% ] 61.26% | 877,504 | 6.2% |
[ 61.5% - 62.0% ] 61.73% | 423,438 | 7.7% |
[ 62.0% - 62.5% ] 62.27% | 430,494 | 8.8% |
[ 62.5% - 63.0% ] 62.78% | 513,120 | 6.5% |
[ 63.0% - 63.5% ] 63.24% | 297,681 | 7.0% |
[ 63.5% - 64.0% ] 63.75% | 411,831 | 7.2% |
[ 64.0% - 64.5% ] 64.30% | 1,054,709 | 7.9% |
[ 64.5% - 65.0% ] 64.72% | 321,559 | 6.3% |
[ 65.0% - 65.5% ] 65.21% | 548,657 | 7.7% |
[ 65.5% - 66.0% ] 65.76% | 276,776 | 8.1% |
[ 66.0% - 66.5% ] 66.29% | 267,286 | 6.2% |
[ 66.5% - 67.0% ] 66.83% | 334,313 | 6.9% |
[ 67.0% - 67.5% ] 67.21% | 241,517 | 10.1% |
[ 67.5% - 68.0% ] 67.67% | 184,781 | 8.2% |
[ 68.0% - 68.5% ] 68.15% | 146,220 | 10.2% |
[ 68.5% - 69.0% ] 68.63% | 496,846 | 6.5% |
[ 69.0% - 69.5% ] 69.27% | 203,442 | 8.5% |
[ 69.5% - 70.0% ] 69.77% | 131,741 | 7.6% |
[ 70.0% - 70.5% ] 70.26% | 272,997 | 7.9% |
[ 70.5% - 71.0% ] 70.70% | 388,302 | 6.9% |
[ 71.0% - 71.5% ] 71.27% | 302,427 | 8.1% |
[ 71.5% - 72.0% ] 71.71% | 216,344 | 9.0% |
[ 72.0% - 72.5% ] 72.20% | 235,057 | 9.4% |
[ 72.5% - 73.0% ] 72.65% | 180,416 | 9.0% |
[ 73.0% - 73.5% ] 73.16% | 262,807 | 8.8% |
[ 73.5% - 74.0% ] 73.79% | 354,811 | 7.5% |
[ 74.0% - 74.5% ] 74.25% | 246,676 | 10.2% |
[ 74.5% - 75.0% ] 74.67% | 269,515 | 7.7% |
[ 75.0% - 75.5% ] 75.24% | 177,388 | 6.6% |
[ 75.5% - 76.0% ] 75.77% | 246,354 | 8.5% |
[ 76.0% - 76.5% ] 76.30% | 238,477 | 9.7% |
[ 76.5% - 77.0% ] 76.66% | 110,318 | 9.4% |
[ 77.0% - 77.5% ] 77.38% | 232,540 | 7.4% |
[ 77.5% - 78.0% ] 77.78% | 840,919 | 11.8% |
[ 78.0% - 78.5% ] 78.22% | 225,751 | 9.4% |
[ 78.5% - 79.0% ] 78.83% | 262,185 | 10.1% |
[ 79.0% - 79.5% ] 79.27% | 268,002 | 10.4% |
[ 79.5% - 80.0% ] 79.70% | 127,812 | 11.4% |
[ 80.0% - 80.5% ] 80.21% | 284,810 | 7.7% |
[ 80.5% - 81.0% ] 80.65% | 231,412 | 10.4% |
[ 81.0% - 81.5% ] 81.30% | 239,631 | 8.4% |
[ 81.5% - 82.0% ] 81.68% | 297,606 | 6.7% |
[ 82.0% - 82.5% ] 82.19% | 443,151 | 10.1% |
[ 82.5% - 83.0% ] 82.73% | 154,423 | 7.2% |
[ 83.0% - 83.5% ] 83.35% | 82,818 | 11.7% |
[ 83.5% - 84.0% ] 83.88% | 62,252 | 12.0% |
[ 84.0% - 84.5% ] 84.33% | 185,161 | 8.2% |
[ 84.5% - 85.0% ] 84.74% | 164,435 | 8.6% |
[ 85.0% - 85.5% ] 85.25% | 143,736 | 10.4% |
[ 85.5% - 86.0% ] 85.78% | 142,515 | 8.9% |
[ 86.0% - 86.5% ] 86.33% | 144,238 | 8.2% |
[ 86.5% - 87.0% ] 86.65% | 268,725 | 9.8% |
[ 87.0% - 87.5% ] 87.27% | 171,139 | 6.6% |
[ 87.5% - 88.0% ] 87.74% | 207,433 | 9.3% |
[ 88.0% - 88.5% ] 88.28% | 148,868 | 9.0% |
[ 88.5% - 89.0% ] 88.77% | 203,046 | 11.3% |
[ 89.0% - 89.5% ] 89.17% | 153,165 | 9.9% |
[ 89.5% - 90.0% ] 89.70% | 226,078 | 9.5% |
[ 90.0% - 90.5% ] 90.19% | 86,678 | 11.7% |
[ 90.5% - 91.0% ] 90.87% | 100,090 | 8.6% |
[ 91.0% - 91.5% ] 91.23% | 371,056 | 10.7% |
[ 91.5% - 92.0% ] 91.81% | 135,954 | 13.1% |
[ 92.0% - 92.5% ] 92.26% | 97,972 | 12.5% |
[ 92.5% - 93.0% ] 92.70% | 161,513 | 12.3% |
[ 93.0% - 93.5% ] 93.22% | 184,300 | 11.1% |
[ 93.5% - 94.0% ] 93.70% | 269,057 | 11.6% |
[ 94.0% - 94.5% ] 94.38% | 115,719 | 13.2% |
[ 94.5% - 95.0% ] 94.72% | 106,484 | 9.9% |
[ 95.0% - 95.5% ] 95.24% | 83,470 | 15.1% |
[ 95.5% - 96.0% ] 95.80% | 80,290 | 12.6% |
[ 96.0% - 96.5% ] 96.26% | 44,816 | 16.1% |
[ 96.5% - 97.0% ] 96.82% | 13,910 | 17.4% |
[ 97.0% - 97.5% ] 97.20% | 4,394 | 13.2% |
[ 98.0% - 98.5% ] 98.32% | 9,124 | 14.6% |
[ 98.5% - 99.0% ] 98.63% | 16,097 | 9.6% |
[ 99.0% - 99.5% ] 99.22% | 14,089 | 15.0% |
[ 99.5% - 100.0% ] 99.95% | 11,346 | 21.0% |