Tlingit-Haida Female Unemployment

COMPARE

Tlingit-Haida
Race
Ancestry
AfghanAfricanAlaska NativeAlaskan AthabascanAlbanianAleutAlsatianAmericanApacheArabArapahoArgentineanArmenianAssyrian/Chaldean/SyriacAustralianAustrianBahamianBangladeshiBarbadianBasqueBelgianBelizeanBermudanBhutaneseBlackfeetBolivianBrazilianBritishBritish West IndianBulgarianBurmeseCajunCambodianCanadianCape VerdeanCarpatho RusynCelticCentral AmericanCentral American IndianCherokeeCheyenneChickasawChileanChineseChippewaChoctawColombianColvilleComancheCosta RicanCreeCreekCroatianCrowCubanCypriotCzechCzechoslovakianDanishDelawareDominicanDutchDutch West IndianEastern EuropeanEcuadorianEgyptianEnglishEstonianEthiopianEuropeanFijianFilipinoFinnishFrenchFrench American IndianFrench CanadianGermanGerman RussianGhanaianGreekGuamanian/ChamorroGuatemalanGuyaneseHaitianHmongHonduranHopiHoumaHungarianIcelanderIndian (Asian)IndonesianInupiatIranianIraqiIrishIroquoisIsraeliItalianJamaicanJapaneseJordanianKenyanKiowaKoreanLaotianLatvianLebaneseLiberianLithuanianLumbeeLuxembourgerMacedonianMalaysianMalteseMarshalleseMenomineeMexicanMexican American IndianMongolianMoroccanNative HawaiianNavajoNepaleseNew ZealanderNicaraguanNigerianNorthern EuropeanNorwegianOkinawanOsageOttawaPaiutePakistaniPalestinianPanamanianParaguayanPennsylvania GermanPeruvianPimaPolishPortuguesePotawatomiPuebloPuerto RicanPuget Sound SalishRomanianRussianSalvadoranSamoanScandinavianScotch-IrishScottishSeminoleSenegaleseSerbianShoshoneSierra LeoneanSiouxSlavicSlovakSloveneSomaliSouth AfricanSouth AmericanSouth American IndianSoviet UnionSpaniardSpanishSpanish AmericanSpanish American IndianSri LankanSubsaharan AfricanSudaneseSwedishSwissSyrianTaiwaneseThaiTlingit-HaidaTohono O'OdhamTonganTrinidadian and TobagonianTsimshianTurkishU.S. Virgin IslanderUgandanUkrainianUruguayanUteVenezuelanVietnameseWelshWest IndianYakamaYaquiYugoslavianYumanYup'ikZimbabwean
Immigration
NonimmigrantsImmigrantsAfghanistanAfricaAlbaniaArgentinaArmeniaAsiaAustraliaAustriaBahamasBangladeshBarbadosBelarusBelgiumBelizeBoliviaBosnia and HerzegovinaBrazilBulgariaBurma/MyanmarCabo VerdeCambodiaCameroonCanadaCaribbeanCentral AmericaChileChinaColombiaCongoCosta RicaCroatiaCubaCzechoslovakiaDenmarkDominicaDominican RepublicEastern AfricaEastern AsiaEastern EuropeEcuadorEgyptEl SalvadorEnglandEritreaEthiopiaEuropeFijiFranceGermanyGhanaGreeceGrenadaGuatemalaGuyanaHaitiHondurasHong KongHungaryIndiaIndonesiaIranIraqIrelandIsraelItalyJamaicaJapanJordanKazakhstanKenyaKoreaKuwaitLaosLatin AmericaLatviaLebanonLiberiaLithuaniaMalaysiaMexicoMicronesiaMiddle AfricaMoldovaMoroccoNepalNetherlandsNicaraguaNigeriaNorth AmericaNorth MacedoniaNorthern AfricaNorthern EuropeNorwayOceaniaPakistanPanamaPeruPhilippinesPolandPortugalRomaniaRussiaSaudi ArabiaScotlandSenegalSerbiaSierra LeoneSingaporeSomaliaSouth AfricaSouth AmericaSouth Central AsiaSouth Eastern AsiaSouthern EuropeSpainSri LankaSt. Vincent and the GrenadinesSudanSwedenSwitzerlandSyriaTaiwanThailandTrinidad and TobagoTurkeyUgandaUkraineUruguayUzbekistanVenezuelaVietnamWest IndiesWestern AfricaWestern AsiaWestern EuropeYemenZaireZimbabweAzores
Select to Compare
Race
Ancestry
AfghanAfricanAlaska NativeAlaskan AthabascanAlbanianAleutAlsatianAmericanApacheArabArapahoArgentineanArmenianAssyrian/Chaldean/SyriacAustralianAustrianBahamianBangladeshiBarbadianBasqueBelgianBelizeanBermudanBhutaneseBlackfeetBolivianBrazilianBritishBritish West IndianBulgarianBurmeseCajunCambodianCanadianCape VerdeanCarpatho RusynCelticCentral AmericanCentral American IndianCherokeeCheyenneChickasawChileanChineseChippewaChoctawColombianColvilleComancheCosta RicanCreeCreekCroatianCrowCubanCypriotCzechCzechoslovakianDanishDelawareDominicanDutchDutch West IndianEastern EuropeanEcuadorianEgyptianEnglishEstonianEthiopianEuropeanFijianFilipinoFinnishFrenchFrench American IndianFrench CanadianGermanGerman RussianGhanaianGreekGuamanian/ChamorroGuatemalanGuyaneseHaitianHmongHonduranHopiHoumaHungarianIcelanderIndian (Asian)IndonesianInupiatIranianIraqiIrishIroquoisIsraeliItalianJamaicanJapaneseJordanianKenyanKiowaKoreanLaotianLatvianLebaneseLiberianLithuanianLumbeeLuxembourgerMacedonianMalaysianMalteseMarshalleseMenomineeMexicanMexican American IndianMongolianMoroccanNative HawaiianNavajoNepaleseNew ZealanderNicaraguanNigerianNorthern EuropeanNorwegianOkinawanOsageOttawaPaiutePakistaniPalestinianPanamanianParaguayanPennsylvania GermanPeruvianPimaPolishPortuguesePotawatomiPuebloPuerto RicanPuget Sound SalishRomanianRussianSalvadoranSamoanScandinavianScotch-IrishScottishSeminoleSenegaleseSerbianShoshoneSierra LeoneanSiouxSlavicSlovakSloveneSomaliSouth AfricanSouth AmericanSouth American IndianSoviet UnionSpaniardSpanishSpanish AmericanSpanish American IndianSri LankanSubsaharan AfricanSudaneseSwedishSwissSyrianTaiwaneseThaiTohono O'OdhamTonganTrinidadian and TobagonianTsimshianTurkishU.S. Virgin IslanderUgandanUkrainianUruguayanUteVenezuelanVietnameseWelshWest IndianYakamaYaquiYugoslavianYumanYup'ikZimbabwean
Immigration
NonimmigrantsImmigrantsAfghanistanAfricaAlbaniaArgentinaArmeniaAsiaAustraliaAustriaBahamasBangladeshBarbadosBelarusBelgiumBelizeBoliviaBosnia and HerzegovinaBrazilBulgariaBurma/MyanmarCabo VerdeCambodiaCameroonCanadaCaribbeanCentral AmericaChileChinaColombiaCongoCosta RicaCroatiaCubaCzechoslovakiaDenmarkDominicaDominican RepublicEastern AfricaEastern AsiaEastern EuropeEcuadorEgyptEl SalvadorEnglandEritreaEthiopiaEuropeFijiFranceGermanyGhanaGreeceGrenadaGuatemalaGuyanaHaitiHondurasHong KongHungaryIndiaIndonesiaIranIraqIrelandIsraelItalyJamaicaJapanJordanKazakhstanKenyaKoreaKuwaitLaosLatin AmericaLatviaLebanonLiberiaLithuaniaMalaysiaMexicoMicronesiaMiddle AfricaMoldovaMoroccoNepalNetherlandsNicaraguaNigeriaNorth AmericaNorth MacedoniaNorthern AfricaNorthern EuropeNorwayOceaniaPakistanPanamaPeruPhilippinesPolandPortugalRomaniaRussiaSaudi ArabiaScotlandSenegalSerbiaSierra LeoneSingaporeSomaliaSouth AfricaSouth AmericaSouth Central AsiaSouth Eastern AsiaSouthern EuropeSpainSri LankaSt. Vincent and the GrenadinesSudanSwedenSwitzerlandSyriaTaiwanThailandTrinidad and TobagoTurkeyUgandaUkraineUruguayUzbekistanVenezuelaVietnamWest IndiesWestern AfricaWestern AsiaWestern EuropeYemenZaireZimbabweAzores
Female Unemployment
Income
Poverty
Unemployment
Labor Participation
Family Structure
Vehicle Availability
Education Level
Disability

Tlingit-Haida Female Unemployment
Exceptional

4.9%
UNEMPLOYMENT | FEMALES
98.3/ 100
METRIC RATING
68th/ 347
METRIC RANK

Tlingit-Haida Female Unemployment Correlation Chart

The statistical analysis conducted on geographies consisting of 60,741,997 people shows no correlation between the proportion of Tlingit-Haida and unemploymnet rate among females in the United States with a correlation coefficient (R) of 0.003 and weighted average of 4.9%. On average, for every 1% (one percent) increase in Tlingit-Haida within a typical geography, there is an increase of 0.0011% in unemploymnet rate among females.
Tlingit-Haida Female Unemployment
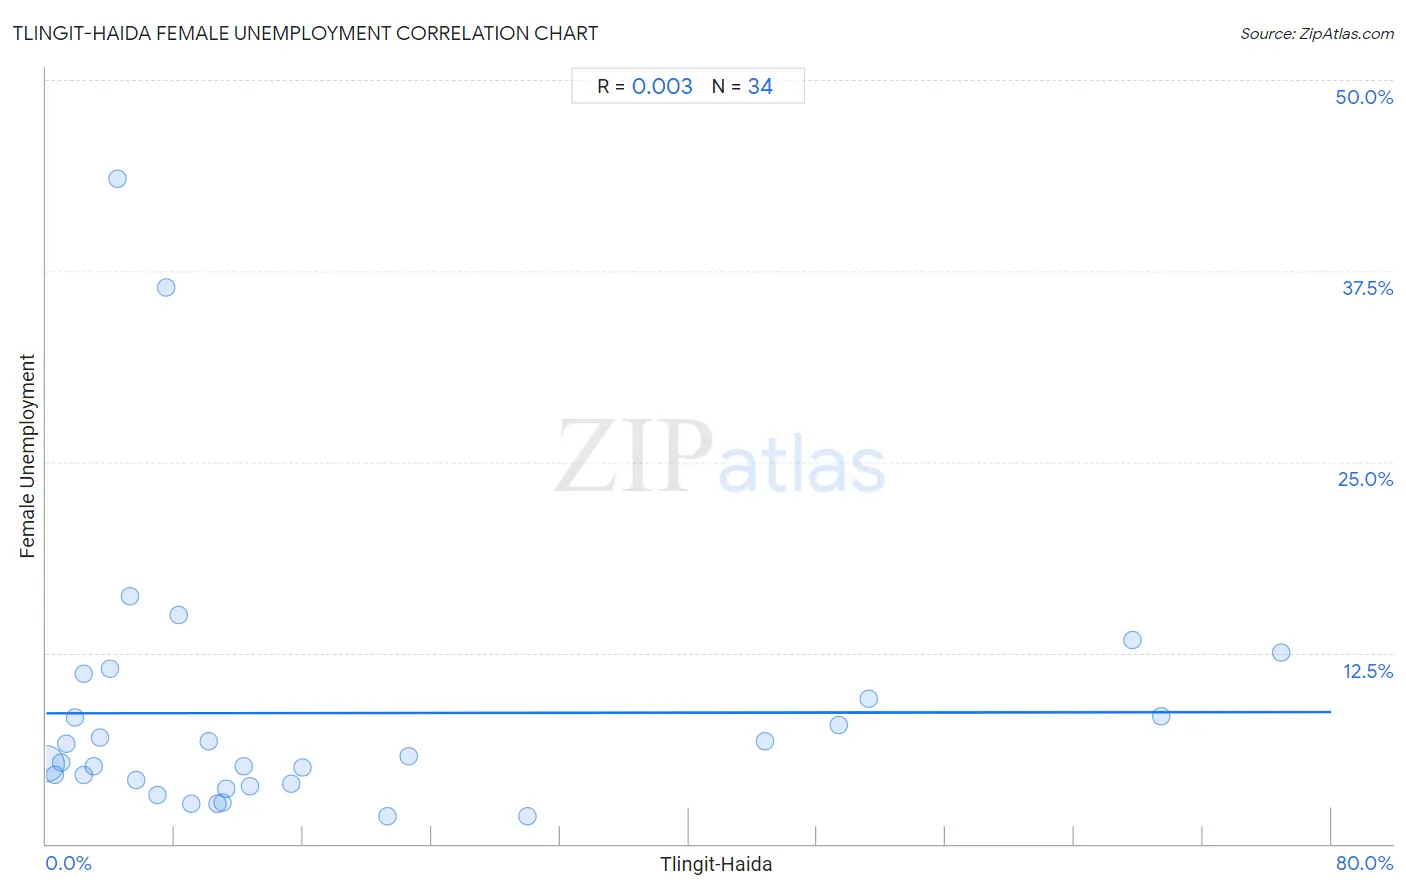
It is essential to understand that the correlation between the percentage of Tlingit-Haida and unemploymnet rate among females does not imply a direct cause-and-effect relationship. It remains uncertain whether the presence of Tlingit-Haida influences an upward or downward trend in the level of unemploymnet rate among females within an area, or if Tlingit-Haida simply ended up residing in those areas with higher or lower levels of unemploymnet rate among females due to other factors.

Demographics Similar to Tlingit-Haida by Female Unemployment

In terms of female unemployment, the demographic groups most similar to Tlingit-Haida are Hungarian (4.9%, a difference of 0.010%), Cuban (4.9%, a difference of 0.010%), Immigrants from Ireland (4.9%, a difference of 0.010%), Immigrants from North America (4.9%, a difference of 0.040%), and Osage (4.9%, a difference of 0.050%).
DemographicsRating | RankFemale Unemployment
Immigrants from Canada
98.6
/100
|
#61
Exceptional
4.9%
Immigrants from Nepal
98.6
/100
|
#62
Exceptional
4.9%
Immigrants from Belgium
98.5
/100
|
#63
Exceptional
4.9%
Celtics
98.5
/100
|
#64
Exceptional
4.9%
Immigrants from North America
98.3
/100
|
#65
Exceptional
4.9%
Hungarians
98.3
/100
|
#66
Exceptional
4.9%
Cubans
98.3
/100
|
#67
Exceptional
4.9%
Tlingit-Haida
98.3
/100
|
#68
Exceptional
4.9%
Immigrants from Ireland
98.2
/100
|
#69
Exceptional
4.9%
Osage
98.2
/100
|
#70
Exceptional
4.9%
German Russians
98.1
/100
|
#71
Exceptional
4.9%
Immigrants from Northern Europe
98.0
/100
|
#72
Exceptional
4.9%
Russians
98.0
/100
|
#73
Exceptional
5.0%
Immigrants from Bolivia
98.0
/100
|
#74
Exceptional
5.0%
Immigrants from Singapore
98.0
/100
|
#75
Exceptional
5.0%

Tlingit-Haida Female Unemployment Correlation Summary

MeasurementTlingit-Haida DataFemale Unemployment Data
Minimum0.036%1.8%
Maximum76.8%43.5%
Range76.8%41.7%
Mean17.6%8.6%
Median9.6%5.5%
Interquartile 25% (IQ1)3.4%3.9%
Interquartile 75% (IQ3)21.2%9.5%
Interquartile Range (IQR)17.9%5.6%
Standard Deviation (Sample)21.6%8.8%
Standard Deviation (Population)21.2%8.7%

Correlation Details

Tlingit-Haida PercentileSample SizeFemale Unemployment
[
0.0%
-
0.5%
]
0.036%
58,988,9295.2%
[
0.5%
-
1.0%
]
0.55%
1,271,0334.5%
[
0.5%
-
1.0%
]
0.91%
235,6515.4%
[
1.0%
-
1.5%
]
1.22%
72,6306.6%
[
1.5%
-
2.0%
]
1.76%
17,2508.3%
[
2.0%
-
2.5%
]
2.30%
7,3824.5%
[
2.0%
-
2.5%
]
2.37%
1,52011.1%
[
2.5%
-
3.0%
]
2.95%
3,6895.1%
[
3.0%
-
3.5%
]
3.36%
8,9306.9%
[
3.5%
-
4.0%
]
3.97%
1,96411.5%
[
4.0%
-
4.5%
]
4.41%
6843.5%
[
5.0%
-
5.5%
]
5.24%
42016.2%
[
5.5%
-
6.0%
]
5.62%
1,7624.2%
[
6.5%
-
7.0%
]
6.94%
2,1463.2%
[
7.0%
-
7.5%
]
7.50%
4036.4%
[
8.0%
-
8.5%
]
8.22%
14615.0%
[
8.5%
-
9.0%
]
9.00%
6,6912.7%
[
10.0%
-
10.5%
]
10.13%
2,9026.7%
[
10.5%
-
11.0%
]
10.70%
29,9332.6%
[
11.0%
-
11.5%
]
11.00%
32,1082.7%
[
11.0%
-
11.5%
]
11.18%
13,9133.6%
[
12.0%
-
12.5%
]
12.26%
18,0415.0%
[
12.5%
-
13.0%
]
12.67%
8,1683.8%
[
15.0%
-
15.5%
]
15.26%
2,1693.9%
[
15.5%
-
16.0%
]
15.92%
1,7275.0%
[
21.0%
-
21.5%
]
21.23%
4,2671.8%
[
22.5%
-
23.0%
]
22.55%
1,0735.7%
[
29.5%
-
30.0%
]
29.96%
1,1281.8%
[
44.5%
-
45.0%
]
44.78%
9206.7%
[
49.0%
-
49.5%
]
49.33%
1,7927.8%
[
51.0%
-
51.5%
]
51.24%
8049.5%
[
67.5%
-
68.0%
]
67.59%
36113.3%
[
69.0%
-
69.5%
]
69.41%
1,6028.3%
[
76.5%
-
77.0%
]
76.85%
83812.5%