Guamanian/Chamorro vs Bahamian Female Unemployment
COMPARE
Guamanian/Chamorro
Bahamian
Female Unemployment
Female Unemployment Comparison
Guamanians/Chamorros
Bahamians
5.6%
FEMALE UNEMPLOYMENT
1.4/ 100
METRIC RATING
245th/ 347
METRIC RANK
6.0%
FEMALE UNEMPLOYMENT
0.0/ 100
METRIC RATING
276th/ 347
METRIC RANK
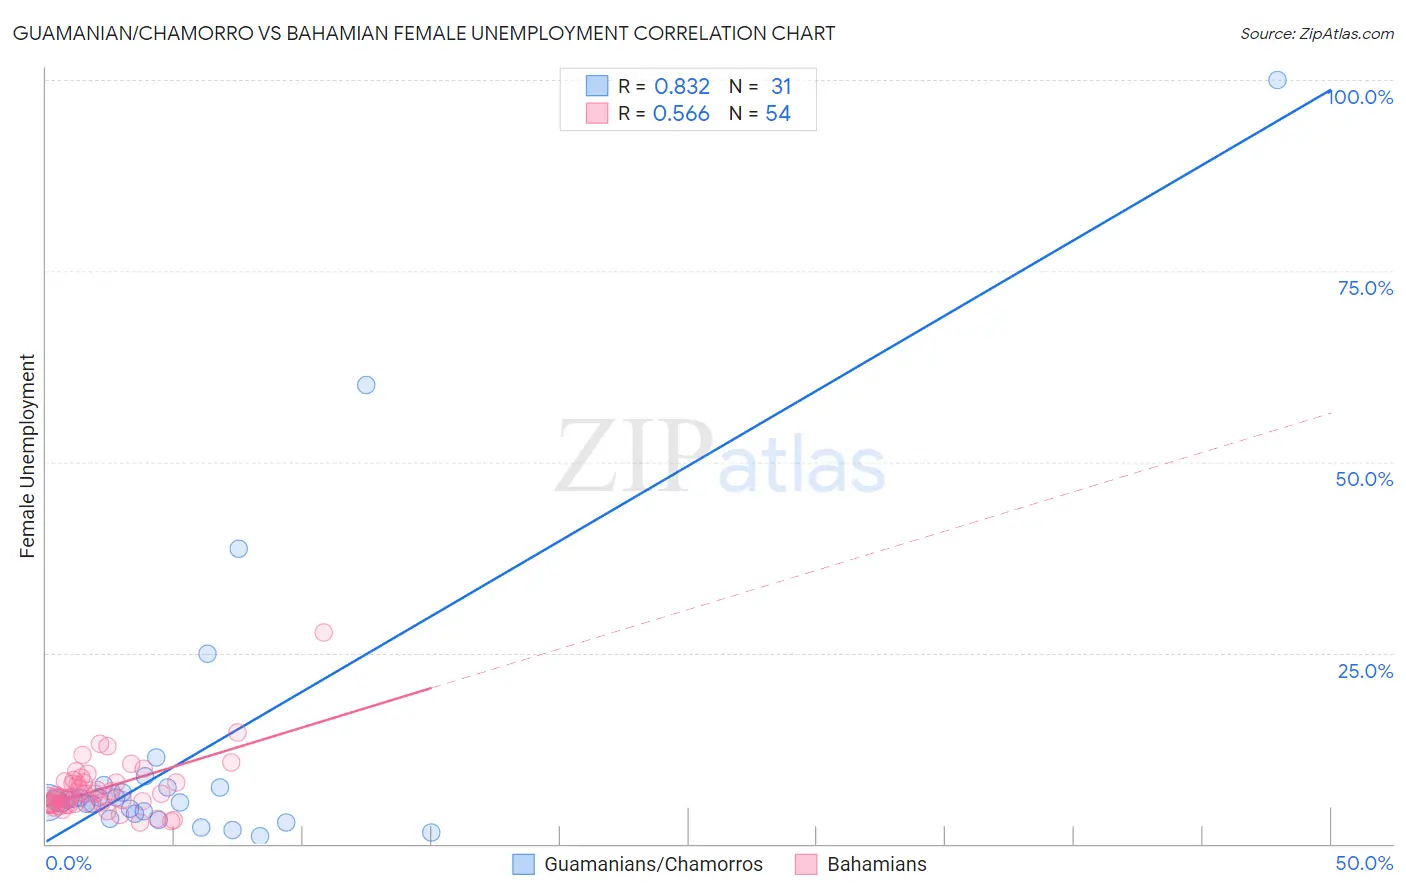
Guamanian/Chamorro vs Bahamian Female Unemployment Correlation Chart
The statistical analysis conducted on geographies consisting of 221,394,828 people shows a very strong positive correlation between the proportion of Guamanians/Chamorros and unemploymnet rate among females in the United States with a correlation coefficient (R) of 0.832 and weighted average of 5.6%. Similarly, the statistical analysis conducted on geographies consisting of 112,545,227 people shows a substantial positive correlation between the proportion of Bahamians and unemploymnet rate among females in the United States with a correlation coefficient (R) of 0.566 and weighted average of 6.0%, a difference of 6.9%.
Female Unemployment Correlation Summary
| Measurement | Guamanian/Chamorro | Bahamian |
| Minimum | 1.0% | 2.8% |
| Maximum | 100.0% | 27.7% |
| Range | 99.0% | 24.9% |
| Mean | 11.7% | 7.2% |
| Median | 5.7% | 6.2% |
| Interquartile 25% (IQ1) | 3.9% | 5.2% |
| Interquartile 75% (IQ3) | 7.4% | 8.1% |
| Interquartile Range (IQR) | 3.5% | 2.9% |
| Standard Deviation (Sample) | 20.3% | 3.8% |
| Standard Deviation (Population) | 19.9% | 3.8% |
Similar Demographics by Female Unemployment
Demographics Similar to Guamanians/Chamorros by Female Unemployment
In terms of female unemployment, the demographic groups most similar to Guamanians/Chamorros are Immigrants from Liberia (5.6%, a difference of 0.14%), Japanese (5.6%, a difference of 0.23%), Immigrants from Western Asia (5.6%, a difference of 0.31%), Cree (5.6%, a difference of 0.47%), and Immigrants from Uzbekistan (5.6%, a difference of 0.51%).
| Demographics | Rating | Rank | Female Unemployment |
| Sierra Leoneans | 3.2 /100 | #238 | Tragic 5.5% |
| Aleuts | 3.0 /100 | #239 | Tragic 5.5% |
| Immigrants | South America | 2.9 /100 | #240 | Tragic 5.5% |
| South American Indians | 2.8 /100 | #241 | Tragic 5.5% |
| Marshallese | 2.3 /100 | #242 | Tragic 5.6% |
| Spanish Americans | 2.2 /100 | #243 | Tragic 5.6% |
| Immigrants | Liberia | 1.5 /100 | #244 | Tragic 5.6% |
| Guamanians/Chamorros | 1.4 /100 | #245 | Tragic 5.6% |
| Japanese | 1.2 /100 | #246 | Tragic 5.6% |
| Immigrants | Western Asia | 1.1 /100 | #247 | Tragic 5.6% |
| Cree | 1.0 /100 | #248 | Tragic 5.6% |
| Immigrants | Uzbekistan | 1.0 /100 | #249 | Tragic 5.6% |
| Immigrants | Syria | 0.8 /100 | #250 | Tragic 5.6% |
| Assyrians/Chaldeans/Syriacs | 0.8 /100 | #251 | Tragic 5.6% |
| Cajuns | 0.7 /100 | #252 | Tragic 5.7% |
Demographics Similar to Bahamians by Female Unemployment
In terms of female unemployment, the demographic groups most similar to Bahamians are Senegalese (6.0%, a difference of 0.040%), Immigrants from Ghana (6.0%, a difference of 0.40%), Yaqui (6.0%, a difference of 0.40%), Armenian (6.0%, a difference of 0.51%), and African (5.9%, a difference of 0.53%).
| Demographics | Rating | Rank | Female Unemployment |
| Immigrants | Western Africa | 0.0 /100 | #269 | Tragic 5.9% |
| Immigrants | Honduras | 0.0 /100 | #270 | Tragic 5.9% |
| Central Americans | 0.0 /100 | #271 | Tragic 5.9% |
| Lumbee | 0.0 /100 | #272 | Tragic 5.9% |
| Ghanaians | 0.0 /100 | #273 | Tragic 5.9% |
| Africans | 0.0 /100 | #274 | Tragic 5.9% |
| Senegalese | 0.0 /100 | #275 | Tragic 6.0% |
| Bahamians | 0.0 /100 | #276 | Tragic 6.0% |
| Immigrants | Ghana | 0.0 /100 | #277 | Tragic 6.0% |
| Yaqui | 0.0 /100 | #278 | Tragic 6.0% |
| Armenians | 0.0 /100 | #279 | Tragic 6.0% |
| Mexican American Indians | 0.0 /100 | #280 | Tragic 6.0% |
| Guatemalans | 0.0 /100 | #281 | Tragic 6.0% |
| Colville | 0.0 /100 | #282 | Tragic 6.0% |
| Salvadorans | 0.0 /100 | #283 | Tragic 6.0% |