Zip Codes with the Highest Percentage of Households Without a Vehicle in Corsicana, TX
RELATED REPORTS & OPTIONS
Households without a Cars
Corsicana
Compare Zip Codes
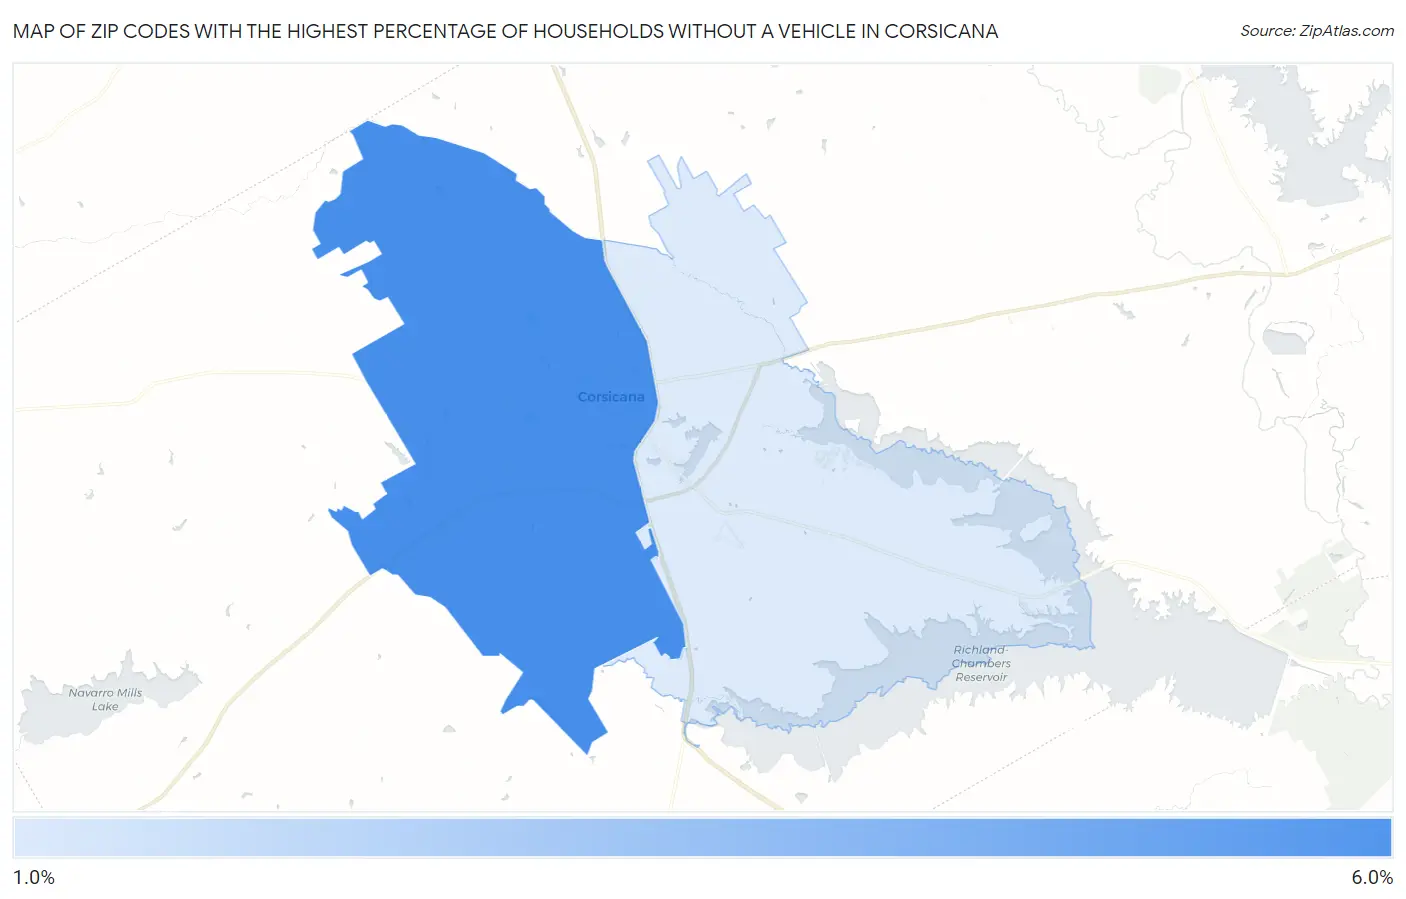
Map of Zip Codes with the Highest Percentage of Households Without a Vehicle in Corsicana
1.9%
5.3%
Zip Codes with the Highest Percentage of Households Without a Vehicle in Corsicana, TX
| Zip Code | Housholds Without a Car | vs State | vs National | |
| 1. | 75110 | 5.3% | 5.3%(=0.000)#615 | 8.3%(-3.00)#12,089 |
| 2. | 75109 | 1.9% | 5.3%(-3.40)#1,311 | 8.3%(-6.40)#22,888 |
1
Common Questions
What are the Top Zip Codes with the Highest Percentage of Households Without a Vehicle in Corsicana, TX?
Top Zip Codes with the Highest Percentage of Households Without a Vehicle in Corsicana, TX are:
What zip code has the Highest Percentage of Households Without a Vehicle in Corsicana, TX?
75110 has the Highest Percentage of Households Without a Vehicle in Corsicana, TX with 5.3%.
What is the Percentage of Households Without a Vehicle in Corsicana, TX?
Percentage of Households Without a Vehicle in Corsicana is 6.3%.
What is the Percentage of Households Without a Vehicle in Texas?
Percentage of Households Without a Vehicle in Texas is 5.3%.
What is the Percentage of Households Without a Vehicle in the United States?
Percentage of Households Without a Vehicle in the United States is 8.3%.