Zip Codes with the Highest Percentage of Population Employed in Transportation & Warehousing in Corsicana, TX
RELATED REPORTS & OPTIONS
Transportation & Warehousing
Corsicana
Compare Zip Codes
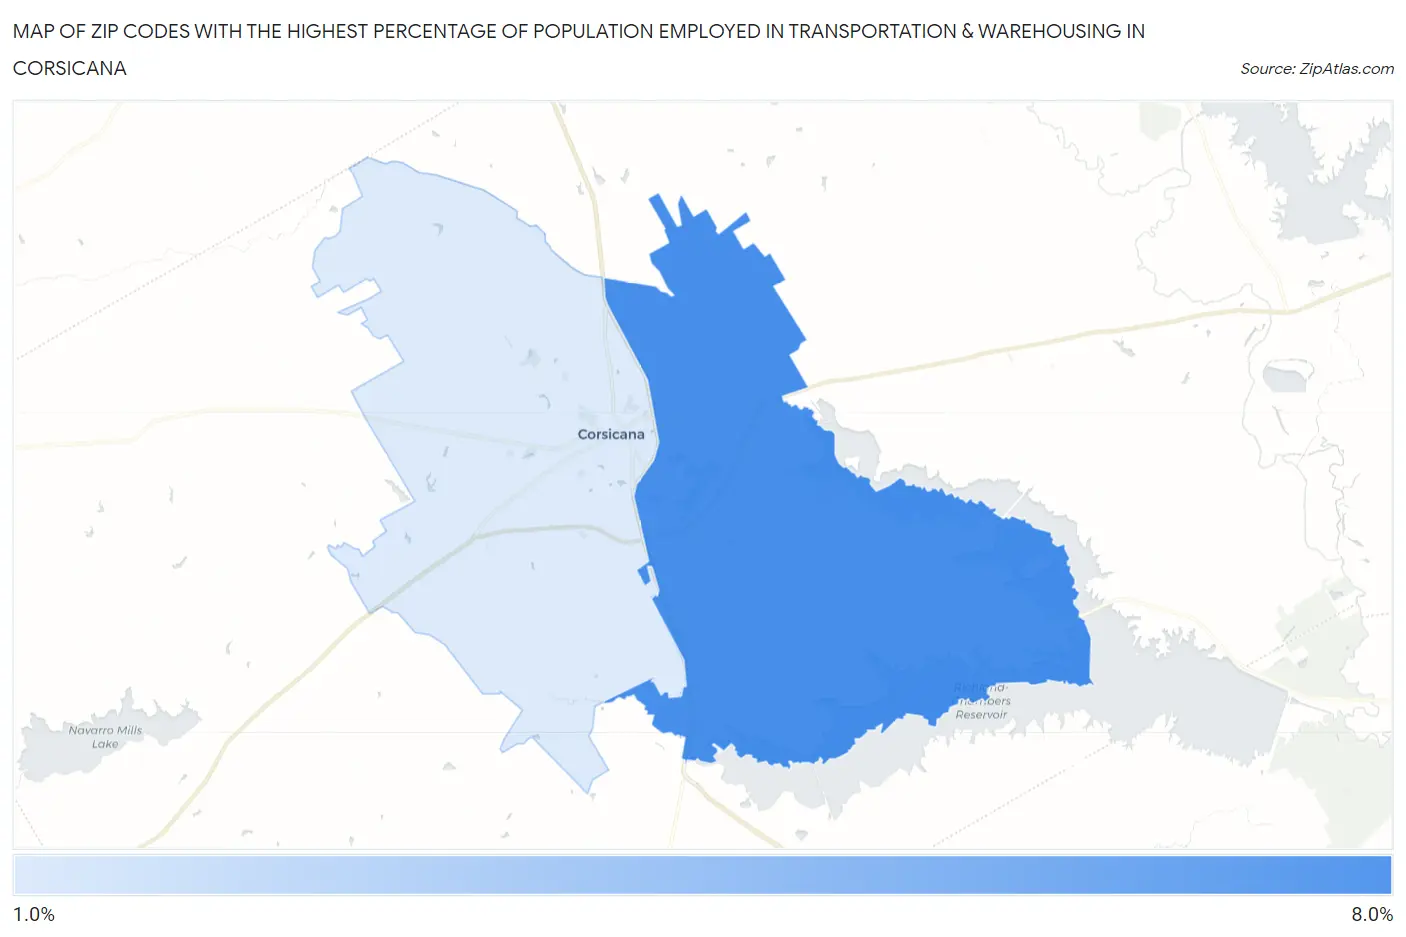
Map of Zip Codes with the Highest Percentage of Population Employed in Transportation & Warehousing in Corsicana
0.0%
8.0%
Zip Codes with the Highest Percentage of Population Employed in Transportation & Warehousing in Corsicana, TX
| Zip Code | % Employed | vs State | vs National | |
| 1. | 75109 | 7.7% | 5.5%(+2.25)#372 | 4.9%(+2.80)#5,253 |
| 2. | 75110 | 1.9% | 5.5%(-3.63)#1,518 | 4.9%(-3.07)#24,701 |
1
Common Questions
What are the Top Zip Codes with the Highest Percentage of Population Employed in Transportation & Warehousing in Corsicana, TX?
Top Zip Codes with the Highest Percentage of Population Employed in Transportation & Warehousing in Corsicana, TX are:
What zip code has the Highest Percentage of Population Employed in Transportation & Warehousing in Corsicana, TX?
75109 has the Highest Percentage of Population Employed in Transportation & Warehousing in Corsicana, TX with 7.7%.
What is the Percentage of Population Employed in Transportation & Warehousing in Corsicana, TX?
Percentage of Population Employed in Transportation & Warehousing in Corsicana is 1.6%.
What is the Percentage of Population Employed in Transportation & Warehousing in Texas?
Percentage of Population Employed in Transportation & Warehousing in Texas is 5.5%.
What is the Percentage of Population Employed in Transportation & Warehousing in the United States?
Percentage of Population Employed in Transportation & Warehousing in the United States is 4.9%.