Zip Codes with the Highest Percentage of Population Employed in Community & Social Service in Corsicana, TX
RELATED REPORTS & OPTIONS
Community & Social Service
Corsicana
Compare Zip Codes
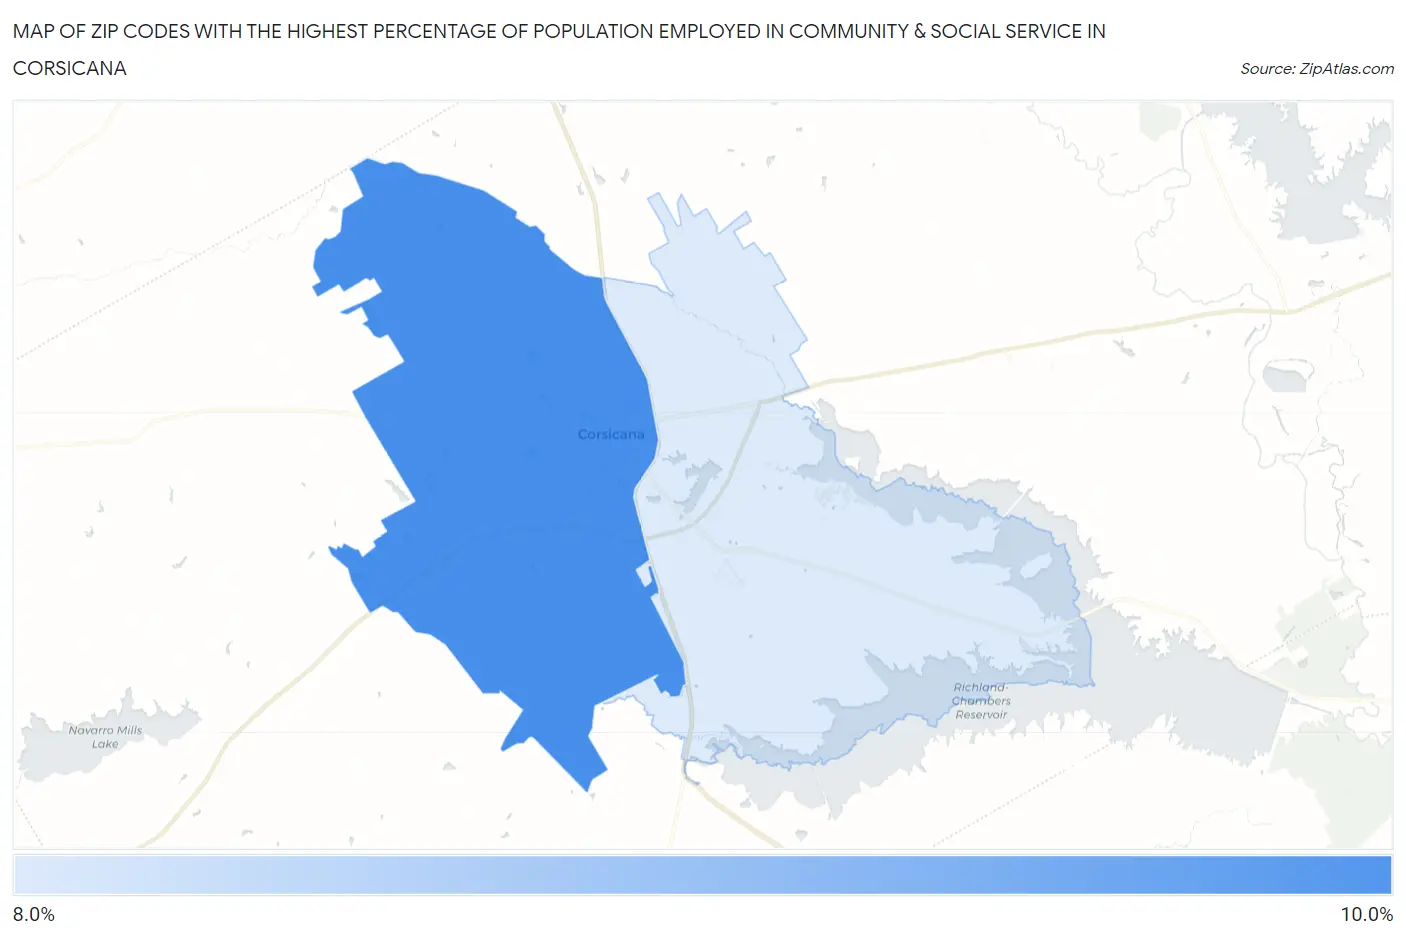
Map of Zip Codes with the Highest Percentage of Population Employed in Community & Social Service in Corsicana
8.2%
10.0%
Zip Codes with the Highest Percentage of Population Employed in Community & Social Service in Corsicana, TX
| Zip Code | % Employed | vs State | vs National | |
| 1. | 75110 | 10.0% | 10.5%(-0.521)#835 | 11.2%(-1.23)#14,171 |
| 2. | 75109 | 8.2% | 10.5%(-2.34)#1,148 | 11.2%(-3.05)#19,112 |
1
Common Questions
What are the Top Zip Codes with the Highest Percentage of Population Employed in Community & Social Service in Corsicana, TX?
Top Zip Codes with the Highest Percentage of Population Employed in Community & Social Service in Corsicana, TX are:
What zip code has the Highest Percentage of Population Employed in Community & Social Service in Corsicana, TX?
75110 has the Highest Percentage of Population Employed in Community & Social Service in Corsicana, TX with 10.0%.
What is the Percentage of Population Employed in Community & Social Service in Corsicana, TX?
Percentage of Population Employed in Community & Social Service in Corsicana is 8.2%.
What is the Percentage of Population Employed in Community & Social Service in Texas?
Percentage of Population Employed in Community & Social Service in Texas is 10.5%.
What is the Percentage of Population Employed in Community & Social Service in the United States?
Percentage of Population Employed in Community & Social Service in the United States is 11.2%.