Zip Codes with the Highest Percentage of Population Employed in Computer, Engineering & Science in Corsicana, TX
RELATED REPORTS & OPTIONS
Computer, Engineering & Science
Corsicana
Compare Zip Codes
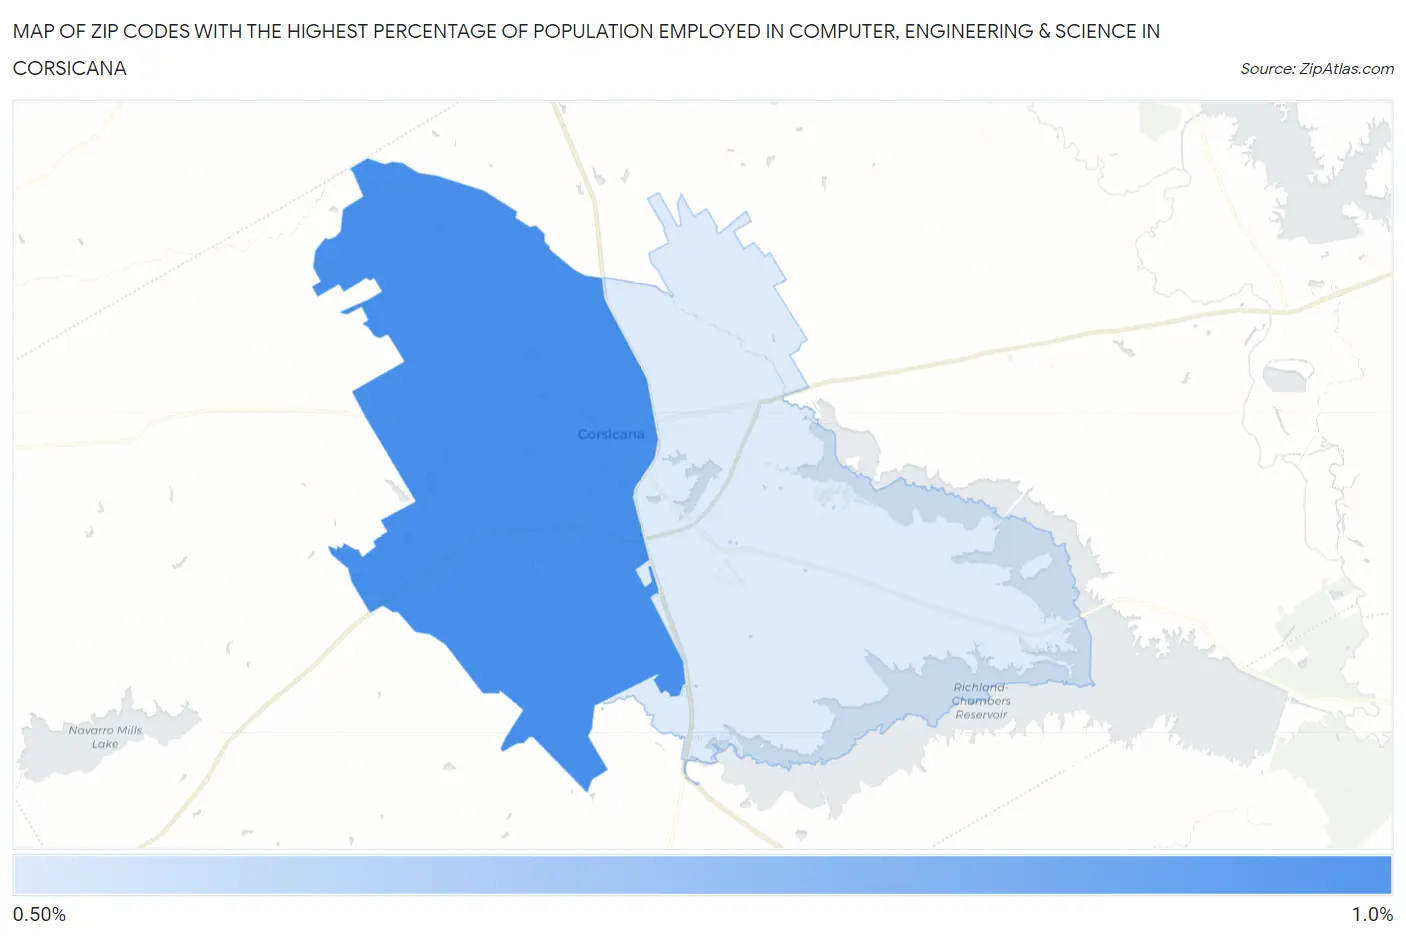
Map of Zip Codes with the Highest Percentage of Population Employed in Computer, Engineering & Science in Corsicana
0.52%
1.00%
Zip Codes with the Highest Percentage of Population Employed in Computer, Engineering & Science in Corsicana, TX
| Zip Code | % Employed | vs State | vs National | |
| 1. | 75110 | 1.00% | 6.5%(-5.50)#1,421 | 6.8%(-5.77)#25,052 |
| 2. | 75109 | 0.52% | 6.5%(-5.98)#1,500 | 6.8%(-6.24)#26,150 |
1
Common Questions
What are the Top Zip Codes with the Highest Percentage of Population Employed in Computer, Engineering & Science in Corsicana, TX?
Top Zip Codes with the Highest Percentage of Population Employed in Computer, Engineering & Science in Corsicana, TX are:
What zip code has the Highest Percentage of Population Employed in Computer, Engineering & Science in Corsicana, TX?
75110 has the Highest Percentage of Population Employed in Computer, Engineering & Science in Corsicana, TX with 1.00%.
What is the Percentage of Population Employed in Computer, Engineering & Science in Corsicana, TX?
Percentage of Population Employed in Computer, Engineering & Science in Corsicana is 1.2%.
What is the Percentage of Population Employed in Computer, Engineering & Science in Texas?
Percentage of Population Employed in Computer, Engineering & Science in Texas is 6.5%.
What is the Percentage of Population Employed in Computer, Engineering & Science in the United States?
Percentage of Population Employed in Computer, Engineering & Science in the United States is 6.8%.