Zip Codes with the Largest Black / African American Community in Corsicana, TX
RELATED REPORTS & OPTIONS
Black / African American
Corsicana
Compare Zip Codes
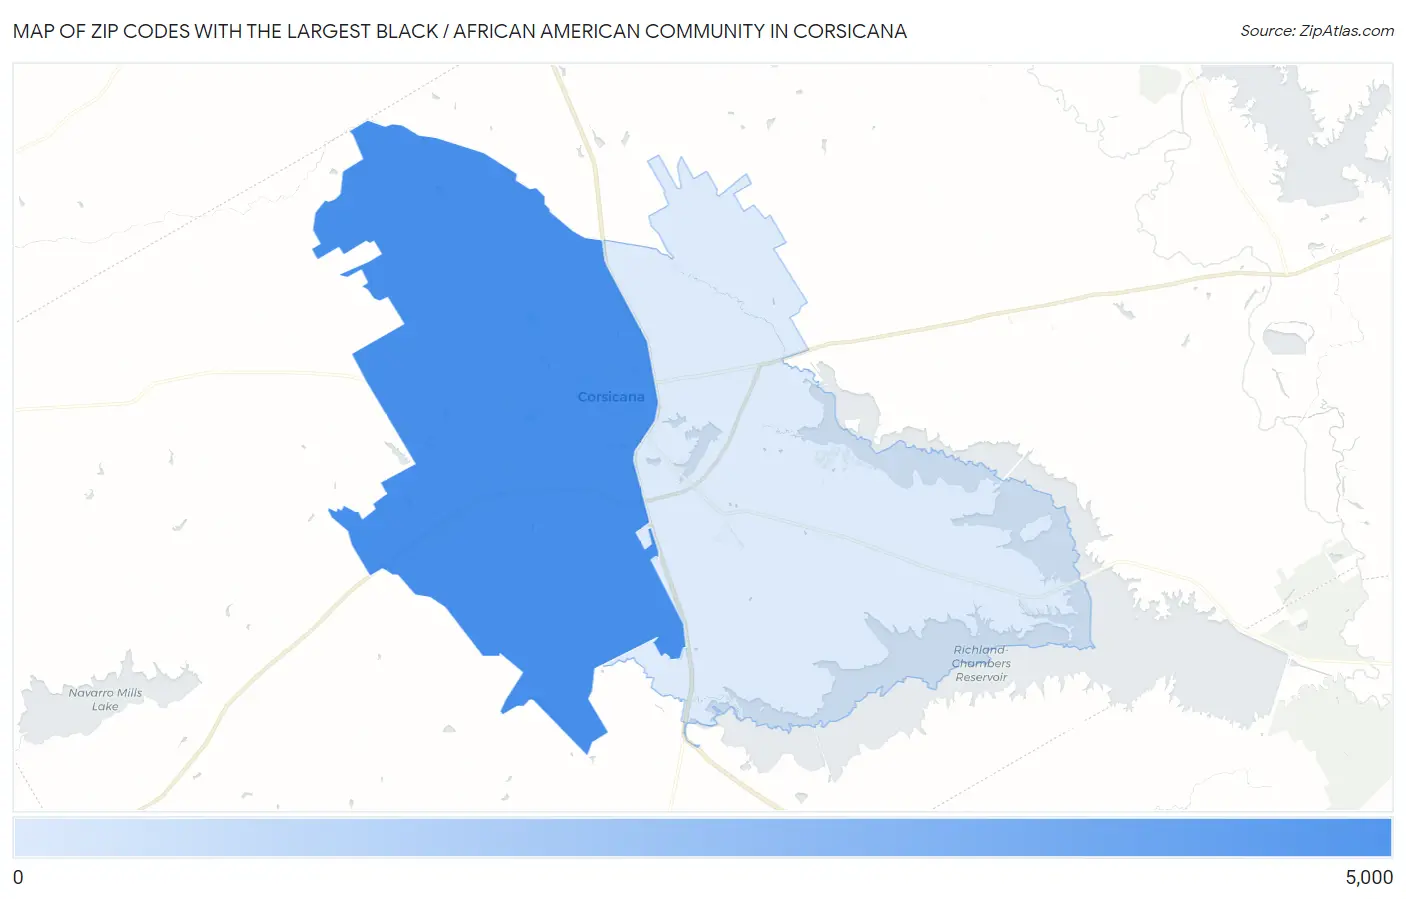
Map of Zip Codes with the Largest Black / African American Community in Corsicana
58
4,565
Zip Codes with the Largest Black / African American Community in Corsicana, TX
| Zip Code | Black / African American | vs State | vs National | |
| 1. | 75110 | 4,565 | 3,552,579(0.13%)#246 | 41,288,572(0.01%)#2,459 |
| 2. | 75109 | 58 | 3,552,579(0.00%)#1,213 | 41,288,572(0.00%)#15,126 |
1
Common Questions
What are the Top Zip Codes with the Largest Black / African American Community in Corsicana, TX?
Top Zip Codes with the Largest Black / African American Community in Corsicana, TX are:
What zip code has the Largest Black / African American Community in Corsicana, TX?
75110 has the Largest Black / African American Community in Corsicana, TX with 4,565.
What is the Total Black / African American Population in Corsicana, TX?
Total Black / African American Population in Corsicana is 4,341.
What is the Total Black / African American Population in Texas?
Total Black / African American Population in Texas is 3,552,579.
What is the Total Black / African American Population in the United States?
Total Black / African American Population in the United States is 41,288,572.