Scottish vs Immigrants from Bahamas Receiving Food Stamps
COMPARE
Scottish
Immigrants from Bahamas
Receiving Food Stamps
Receiving Food Stamps Comparison
Scottish
Immigrants from Bahamas
9.9%
RECEIVING FOOD STAMPS
98.9/ 100
METRIC RATING
71st/ 347
METRIC RANK
15.8%
RECEIVING FOOD STAMPS
0.0/ 100
METRIC RATING
297th/ 347
METRIC RANK
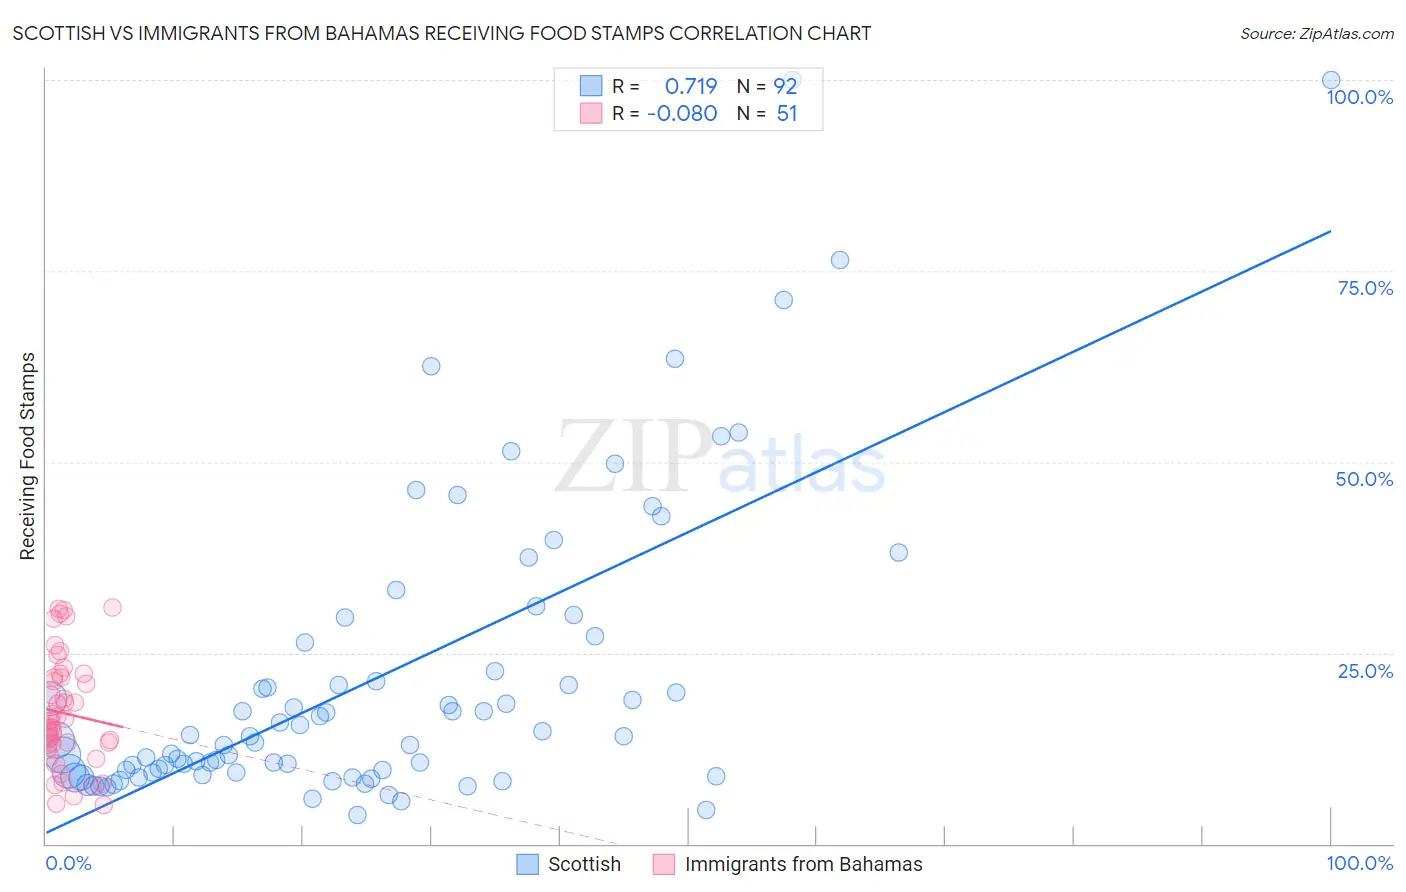
Scottish vs Immigrants from Bahamas Receiving Food Stamps Correlation Chart
The statistical analysis conducted on geographies consisting of 563,544,150 people shows a strong positive correlation between the proportion of Scottish and percentage of population receiving government assistance and/or food stamps in the United States with a correlation coefficient (R) of 0.719 and weighted average of 9.9%. Similarly, the statistical analysis conducted on geographies consisting of 104,572,016 people shows a slight negative correlation between the proportion of Immigrants from Bahamas and percentage of population receiving government assistance and/or food stamps in the United States with a correlation coefficient (R) of -0.080 and weighted average of 15.8%, a difference of 59.6%.
Receiving Food Stamps Correlation Summary
| Measurement | Scottish | Immigrants from Bahamas |
| Minimum | 3.7% | 5.1% |
| Maximum | 100.0% | 31.0% |
| Range | 96.3% | 25.9% |
| Mean | 21.7% | 17.1% |
| Median | 13.8% | 16.0% |
| Interquartile 25% (IQ1) | 9.4% | 13.1% |
| Interquartile 75% (IQ3) | 24.5% | 21.8% |
| Interquartile Range (IQR) | 15.1% | 8.7% |
| Standard Deviation (Sample) | 19.9% | 7.1% |
| Standard Deviation (Population) | 19.8% | 7.0% |
Similar Demographics by Receiving Food Stamps
Demographics Similar to Scottish by Receiving Food Stamps
In terms of receiving food stamps, the demographic groups most similar to Scottish are Immigrants from Serbia (9.9%, a difference of 0.13%), Italian (9.9%, a difference of 0.18%), Immigrants from Asia (9.9%, a difference of 0.24%), Macedonian (9.9%, a difference of 0.30%), and Northern European (9.8%, a difference of 0.39%).
| Demographics | Rating | Rank | Receiving Food Stamps |
| Immigrants | North America | 99.2 /100 | #64 | Exceptional 9.8% |
| Immigrants | Turkey | 99.1 /100 | #65 | Exceptional 9.8% |
| Slovenes | 99.1 /100 | #66 | Exceptional 9.8% |
| Immigrants | Indonesia | 99.0 /100 | #67 | Exceptional 9.8% |
| Northern Europeans | 99.0 /100 | #68 | Exceptional 9.8% |
| Italians | 99.0 /100 | #69 | Exceptional 9.9% |
| Immigrants | Serbia | 99.0 /100 | #70 | Exceptional 9.9% |
| Scottish | 98.9 /100 | #71 | Exceptional 9.9% |
| Immigrants | Asia | 98.9 /100 | #72 | Exceptional 9.9% |
| Macedonians | 98.9 /100 | #73 | Exceptional 9.9% |
| New Zealanders | 98.8 /100 | #74 | Exceptional 9.9% |
| Immigrants | Zimbabwe | 98.7 /100 | #75 | Exceptional 9.9% |
| Immigrants | Croatia | 98.7 /100 | #76 | Exceptional 10.0% |
| Immigrants | North Macedonia | 98.7 /100 | #77 | Exceptional 10.0% |
| South Africans | 98.7 /100 | #78 | Exceptional 10.0% |
Demographics Similar to Immigrants from Bahamas by Receiving Food Stamps
In terms of receiving food stamps, the demographic groups most similar to Immigrants from Bahamas are Tsimshian (15.7%, a difference of 0.16%), Immigrants from Honduras (15.7%, a difference of 0.17%), Immigrants from Trinidad and Tobago (15.8%, a difference of 0.25%), Immigrants from Latin America (15.7%, a difference of 0.49%), and Hispanic or Latino (15.8%, a difference of 0.53%).
| Demographics | Rating | Rank | Receiving Food Stamps |
| Senegalese | 0.0 /100 | #290 | Tragic 15.4% |
| Hondurans | 0.0 /100 | #291 | Tragic 15.5% |
| Alaska Natives | 0.0 /100 | #292 | Tragic 15.6% |
| Vietnamese | 0.0 /100 | #293 | Tragic 15.7% |
| Immigrants | Latin America | 0.0 /100 | #294 | Tragic 15.7% |
| Immigrants | Honduras | 0.0 /100 | #295 | Tragic 15.7% |
| Tsimshian | 0.0 /100 | #296 | Tragic 15.7% |
| Immigrants | Bahamas | 0.0 /100 | #297 | Tragic 15.8% |
| Immigrants | Trinidad and Tobago | 0.0 /100 | #298 | Tragic 15.8% |
| Hispanics or Latinos | 0.0 /100 | #299 | Tragic 15.8% |
| Immigrants | Bangladesh | 0.0 /100 | #300 | Tragic 15.9% |
| Trinidadians and Tobagonians | 0.0 /100 | #301 | Tragic 16.0% |
| Immigrants | West Indies | 0.0 /100 | #302 | Tragic 16.1% |
| Nicaraguans | 0.0 /100 | #303 | Tragic 16.1% |
| West Indians | 0.0 /100 | #304 | Tragic 16.3% |